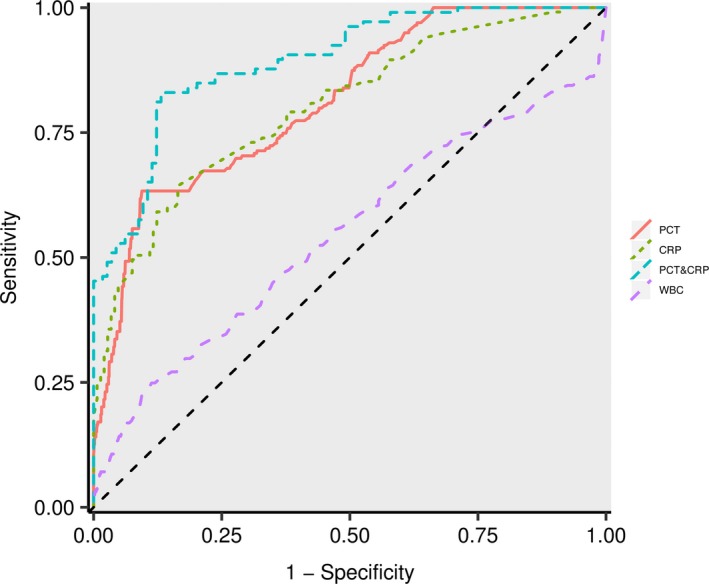
Figure 2.

ROC curves of PCT, CRP, WBC, and PCT&CRP (Logit(P) = −1.912 + 0.546 PCT + 0.087 CRP) for differentiating patients with bacterial co‐infections from those infected with H1N1 alone

ROC curves of PCT, CRP, WBC, and PCT&CRP (Logit(P) = −1.912 + 0.546 PCT + 0.087 CRP) for differentiating patients with bacterial co‐infections from those infected with H1N1 alone