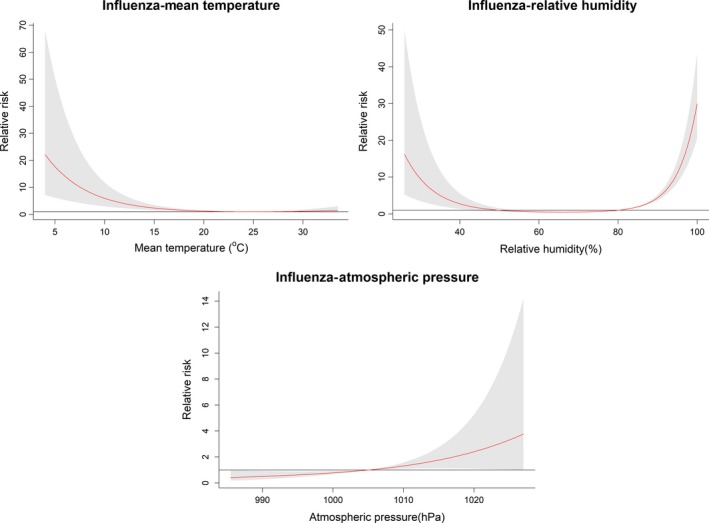
Figure 3.

The estimated overall effects of mean temperature, relative humidity, and atmospheric pressure on children influenza cases over the corresponding lag days. Confounding factors included time trend, DOW, and public holidays. The red lines represent mean relative risks, and gray regions represent 95% confidence intervals. The median value of each meteorological factor (mean temperature: 23.8°C, humidity: 80%, pressure:1005 hPa) is as a reference level
