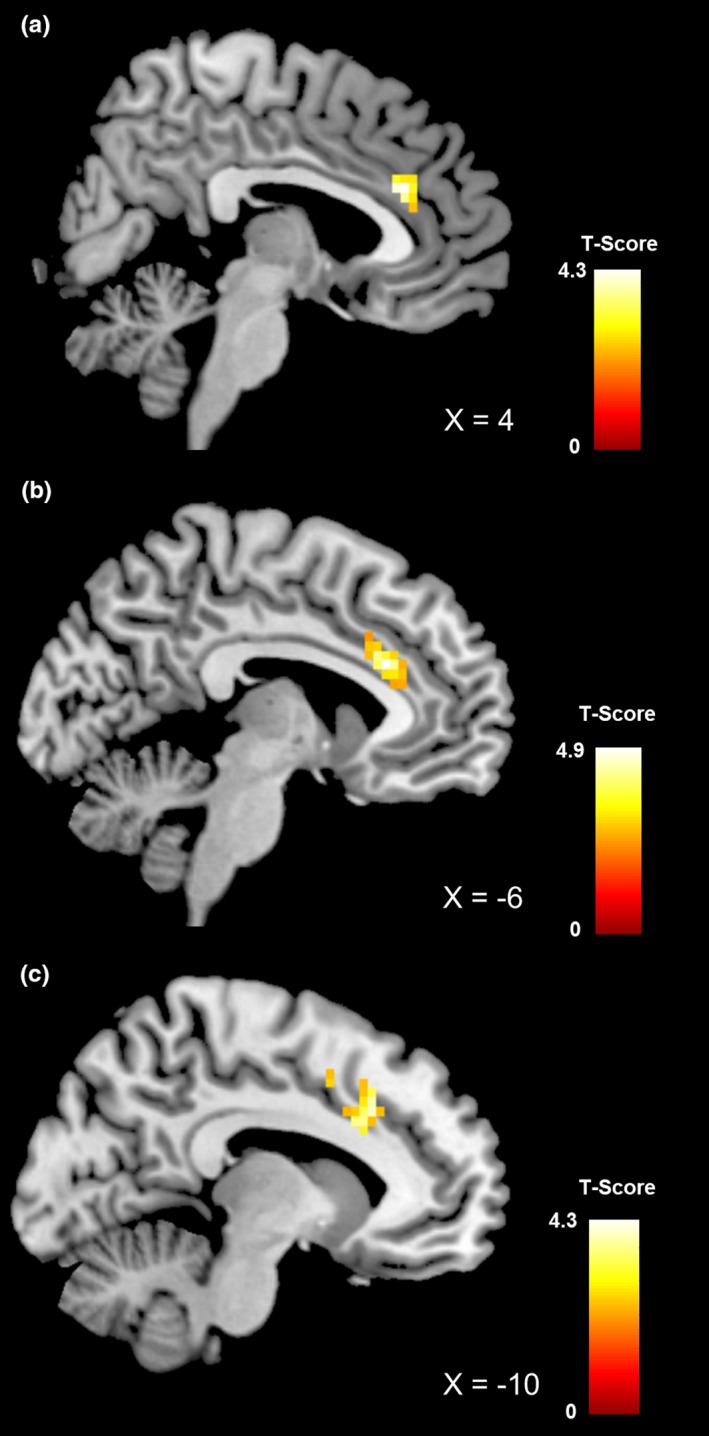
Figure 2.

Brain region showing significant differences in functional connectivity of the salience network between healthy obese control participants and patients with binge eating disorder (a), between healthy normal‐weight control participants and patients with bulimia nervosa (b), and between patients with binge eating disorder and patients with bulimia nervosa (c). All results are cluster‐wise p < 0.05 corrected; color bar represents t‐values
