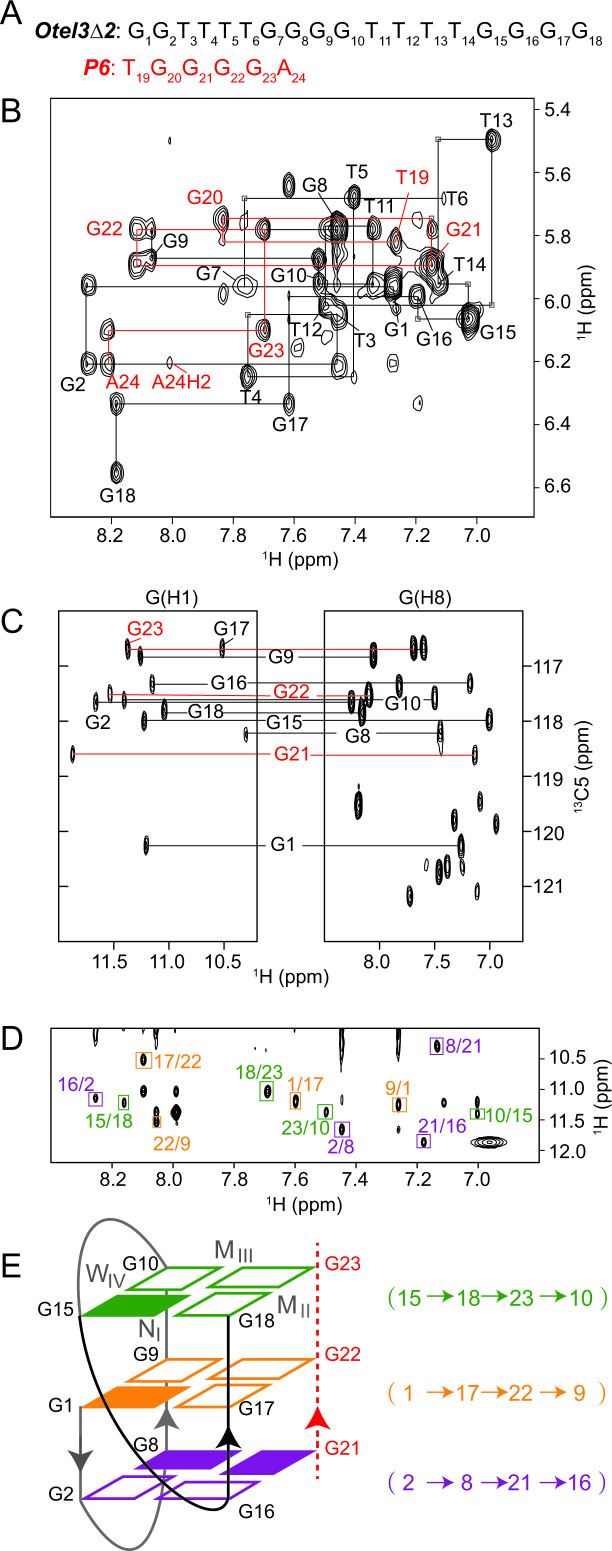
Figure 3.
Folding topology of Otel3Δ2/P6 determined by NMR. (A) The DNA sequences of P6 and Otel3Δ2. The short chain P6 is colored in red. (B) Sequential walking in the NOESY spectrum (250 ms mixing time, D2O) showing the H8/H6-H1′ connectivity of Otel3Δ2/P6. Cross peaks are labeled with residue names. The residues from the short chain P6 are colored in red. Weak or missing sequential connectivities are labeled with a light gray frame. (C) 1H-13C HMBC spectrum indicating the correlation of guanine H8 and imino protons via 13C5 at natural abundance. G21, G22, and G23 are colored in red. (D) NOESY spectrum (250 ms mixing time, 10% D2O/90% H2O) showing inter-residue imino-H8 cross peaks for the identification of the arrangement of the three G-tetrads. The guanine H1–H8 cross peaks are framed and labeled with residue numbers of the H1 and H8 protons in the first and second positions, respectively. Residues in the same G-tetrad are shown in the same color. (E) Schematic topology of Otel3Δ2/P6. The backbones of the short chain P6 are shown as red dotted lines, and its residues are colored in red. The backbones of the long chain Otel3Δ2 are shown as solid lines, and the V-shape turn (G15–G18) is colored in black. The top, middle, and bottom G-tetrads are colored in green, orange, and purple, respectively. The hydrogen-bond directionality within each G-tetrad is shown in the same color. Syn and anti guanines are indicated by solid and hollow rectangles, respectively. W, M, and N represent wide, medium, and narrow grooves, respectively. I, II, III, and IV indicate grooves I, II, III, and IV, respectively.

