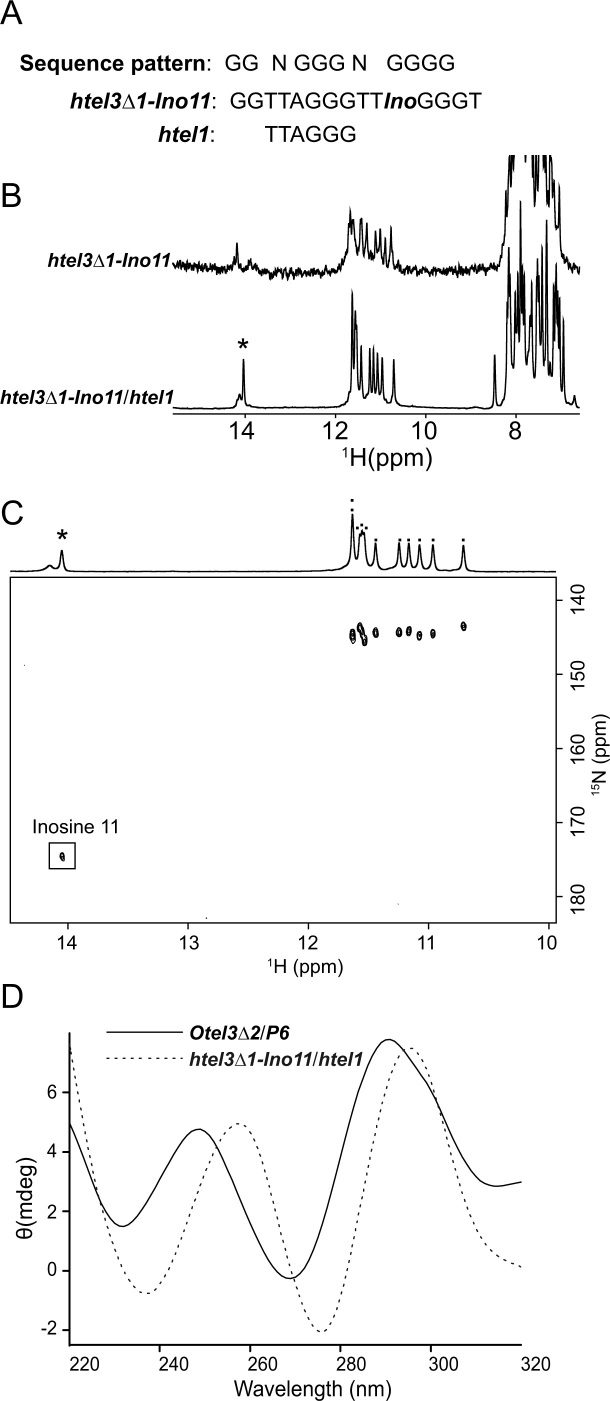
Figure 7.
Interaction of htel3Δ1-Ino11 and htel1. (A) Sequences of htel3Δ1-Ino11 and htel1. The sequence motif d(G2NG3NG4) is shown on top. The residue inosine11 is coded as Ino. (B) One-dimensional 1H spectra of htel3Δ1-Ino11 in the absence and presence of htel1. The inosine imino peak is marked by an asterisk. (C) Two-dimensional 1H-15N HSQC spectrum of htel3Δ1-Ino11/htel1. A one-dimensional imino proton projection is shown. The inosine imino peak is marked by an asterisk in the one-dimensional projection and framed in the two-dimensional spectrum. Other guanine imino peaks are marked by dots in the one-dimensional projection. (D) CD spectra of Otel3Δ2/P6 (indicated by the black solid line) and htel3Δ1-Ino11/htel1 (indicated by the gray dotted line).

