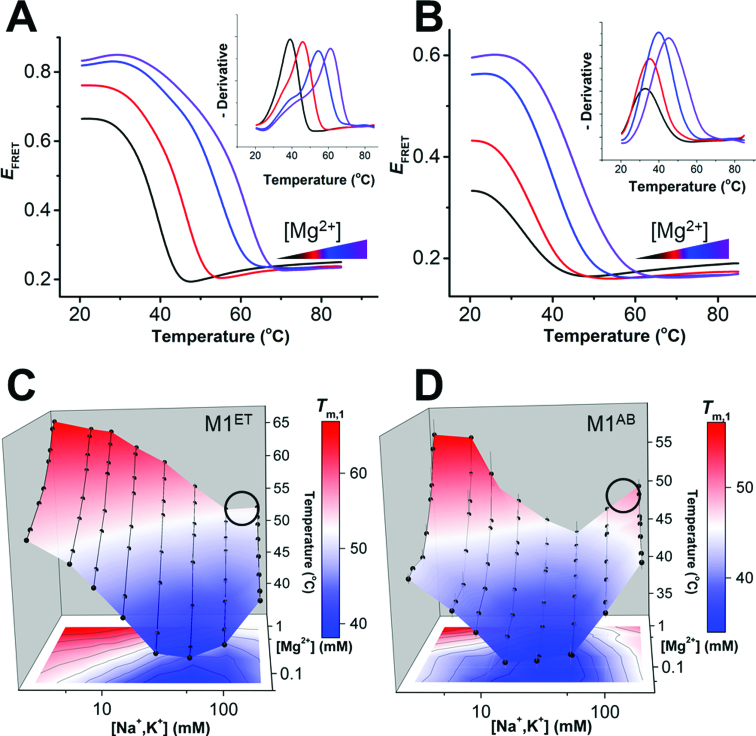
Figure 2.
Triplex stabilities vary across a matrix of monovalent and divalent concentrations. Melting profiles monitored by DS-FRET for M1ET (A) and M1AB (B) under four different magnesium concentrations (∼0.05, 0.2, 0.5 and 1 mM, with increasing concentrations colored from black to purple) in 25 mM total monovalent salt (equimolar NaCl and KCl). See Supplemental Figure S5 for samples of raw Cy3 and Cy5 melting profiles. Inset: Peaks in a plot of the negative derivative of the raw melting profile are used to determine Tm,1 for each experiment. (C, D) Tertiary thermal stability (Tm,1) landscapes of M1ET (C) and M1AB (D) monitored using DS-FRET across multiplexed ionic conditions (2.6, 5.7, 8.8, 15.1, 27.6, 52.6, 102.6 and 202.6 mM total monovalent salt (equimolar KCl and NaCl); and ∼0.05, 0.1, 0.2, 0.3, 0.5, 0.6, 0.8 and 1 mM MgCl2). n = 3 experiments; S.D. A black circle on each stability landscape indicates approximate physiological ionic conditions (∼150 mM monovalent, 1 mM MgCl2).

