Figure 3.
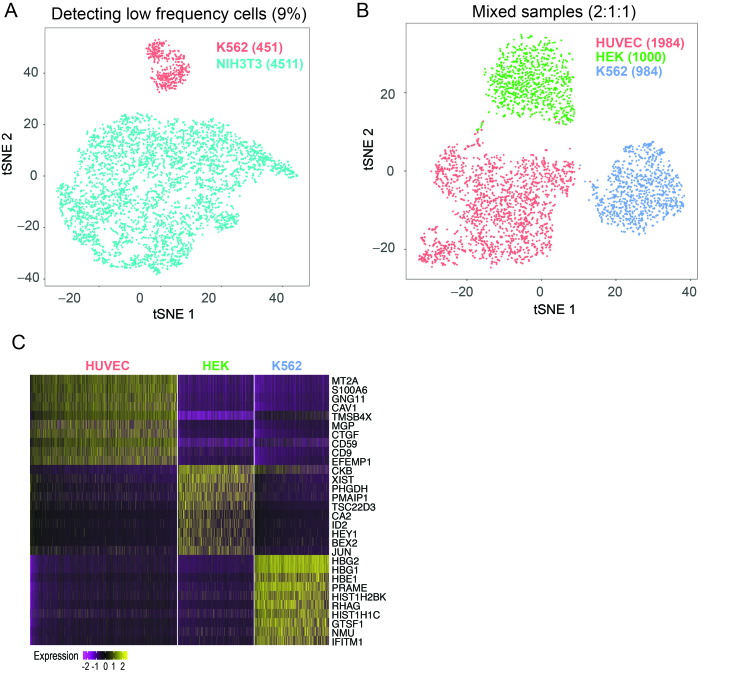
Identifying cell types in mixed samples. (A) t-SNE plot showing the clustering results from a mixture of human K562 and mouse NIH3T3 cells mixed at 1:10 ratio. 5062 cells were identified after alignment and filtering, of which 451 cells were inferred as human and 4511 as mouse. (B) t-SNE plot showing the sequencing results of a mixture of three human cell lines, HEK-K562- HUVEC, mixed at 1:1:2 ratio. Unsupervised clustering analysis identifies three major clusters. (C) Each cluster is identifiable as the corresponding cell type based on expression of cell-type specific genes.

