Figure 5.
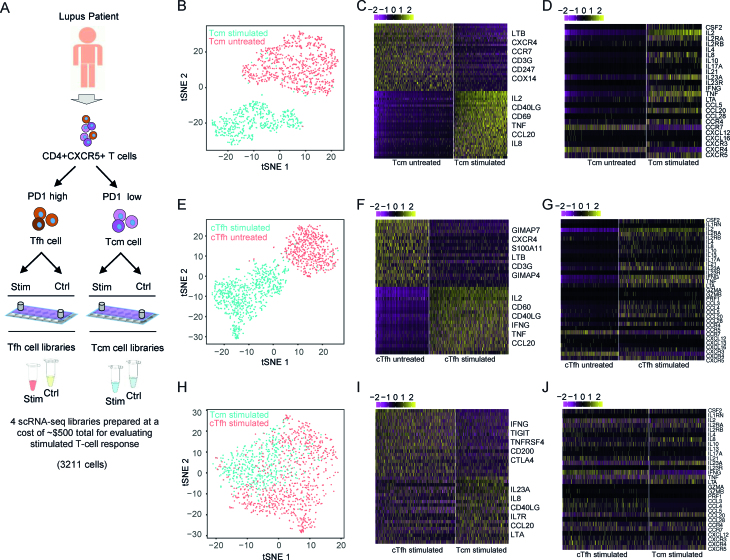
Single cell RNA profiling of circulating CD4+CXCR5+ T cells and activation states in SLE. (A) Schematic depicting experiment design to profile CD4+CXCR5+ T cells. (B) t-SNE plot showing the clustering results of stimulated versus untreated CD4+CXCR5+PD1lowCCR7high T cells (Tcm). Two major clusters are identified that overlap with stimulated (n = 601 cells) and untreated samples (n = 946 cells). (C) Differential gene expression analysis of stimulated and untreated Tcm cells. (D) Comparison of cytokine gene expression between stimulated and untreated Tcm cells. (E) t-SNE plot showing the clustering results of stimulated vs untreated CD4+CXCR5+PD1highCCR7low T cells (cTfh). Two major clusters are identified that overlap with stimulated (n = 926 cells) and untreated samples (n = 738 cells). (F) Differential gene expression analysis of stimulated and untreated cTfh cells. (G) Comparison of cytokine gene expression between stimulated and untreated cTfh cells. (H) t-SNE plot of stimulated Tcm and cTfh cells. (I) Differential gene expression analysis of stimulated Tcm and cTfh cells. (J) Comparison of cytokine gene expression between stimulated Tcm and cTfh cells.

