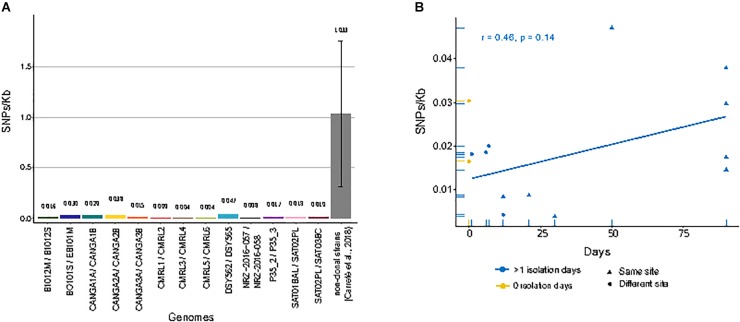
FIGURE 1.
Single nucleotide polymorphisms (SNPs)/Kb between genomes of matched pairs of isolates. (A) Amount of different SNPs/Kb between each compared pair of genomes. Gray bar indicates the average of between all pairs of non-clonal strains from a previous study (Carreté et al., 2018). (B) Correlation between genome-wide mutation density (SNPs/Kb) and days span between the first isolate and second isolate in serial isolates. Yellow dots indicate pairs of strains isolated at the same day from different sites. Blue dots and triangles indicate pairs of strains isolated at different days at different sites or the same site, respectively. Blue line shows linear regression over the blue values.

