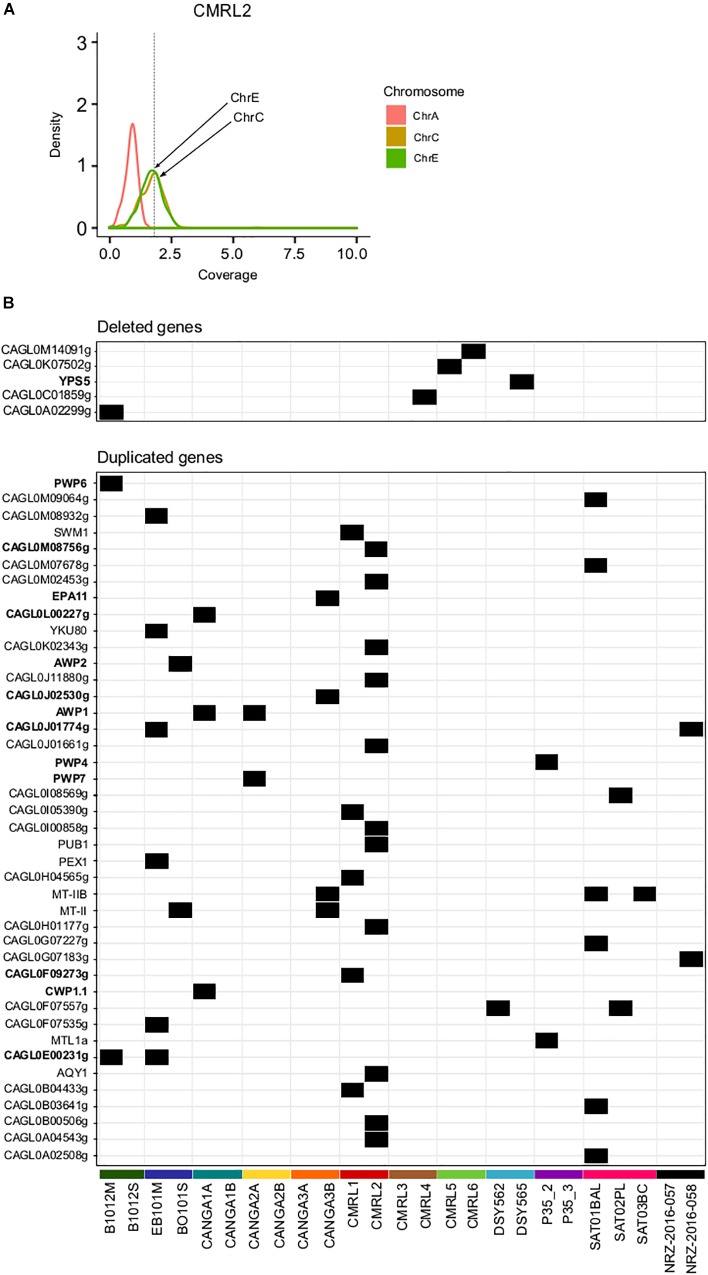
FIGURE 2.
Structural genomic variation in clonal isolates. (A) Aneuploidy found in chromosomes C and E in CMRL2. Chromosome A as a control without any aneuploidy. Y-axis show the distribution of depth of coverage (density) per each chromosome. Vertical dashed line in X-axis indicates the threshold used to detect chromosome duplications (threshold 1.8). Chromosomes affected are marked with arrows. (B) Heatmap showing deleted and duplicated genes that appeared in only one of the two isolates of a pair. Gene name in bold indicates genes related to cell-wall proteins or adhesines.

