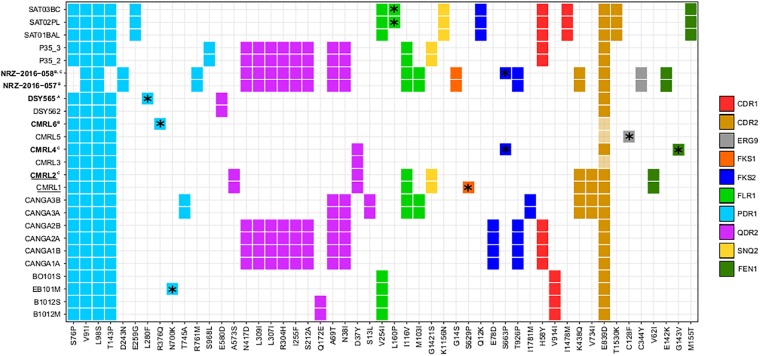
FIGURE 3.
Heatmap showing non-synonymous SNPs, with respect to the reference, in genes related to drug resistance. Each column indicates mutations and each line indicates strains affected by those mutations. Different colors show distinct genes with non-synonymous mutations (CDR1, CDR2, ERG9, FKS1, FKS2, FLR1, PDR1, QDR2, SNQ2, and FEN1). *Indicates mutations that only appear in one strain of pairs. Strain names in bold indicate strains that are resistant to drugs and superscript indicates the drugs involved (A, reduced susceptibility to fluconazole; B, resistant to 5-Fluorocytosine and azoles; and C, resistant to echinocandins). Strain names that appear underlined indicate a possible mislabeling at the data deposition step from the original study (Biswas et al., 2017), see main text.

