
FIGURE 6.
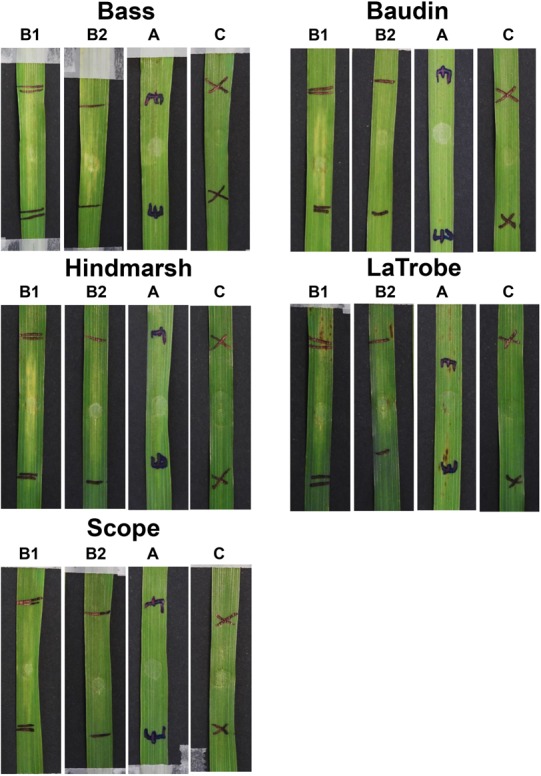
Barley second leaves showing insensitivity to ToxA but displaying varying degree of chlorosis induced by ToxB. Barley leaves were infiltrated with ToxB at the concentration of 500 ng/μl (B1) and 200 ng/μl (B2), and E. coli crude cell extract containing ToxA (A). C, empty vector as control.