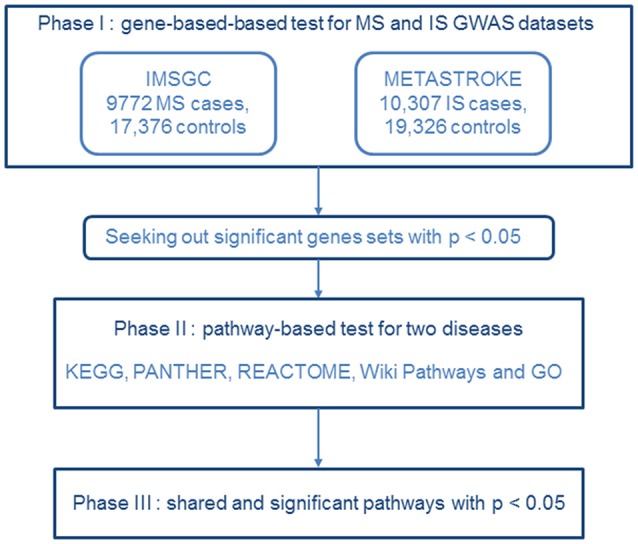
Figure 1.

Flow diagram of the three-phase analysis design. In phase I, we performed a gene-based test using the MS dataset from IMSGC and the IS GWAS dataset from METASTROKE. Gene sets identified with p < 0.05 were carried forward to the next phase. In phase II, we carried out a pathway-based analysis for the two diseases. In phase III, shared and significant pathways were identified that had p's < 0.05.
