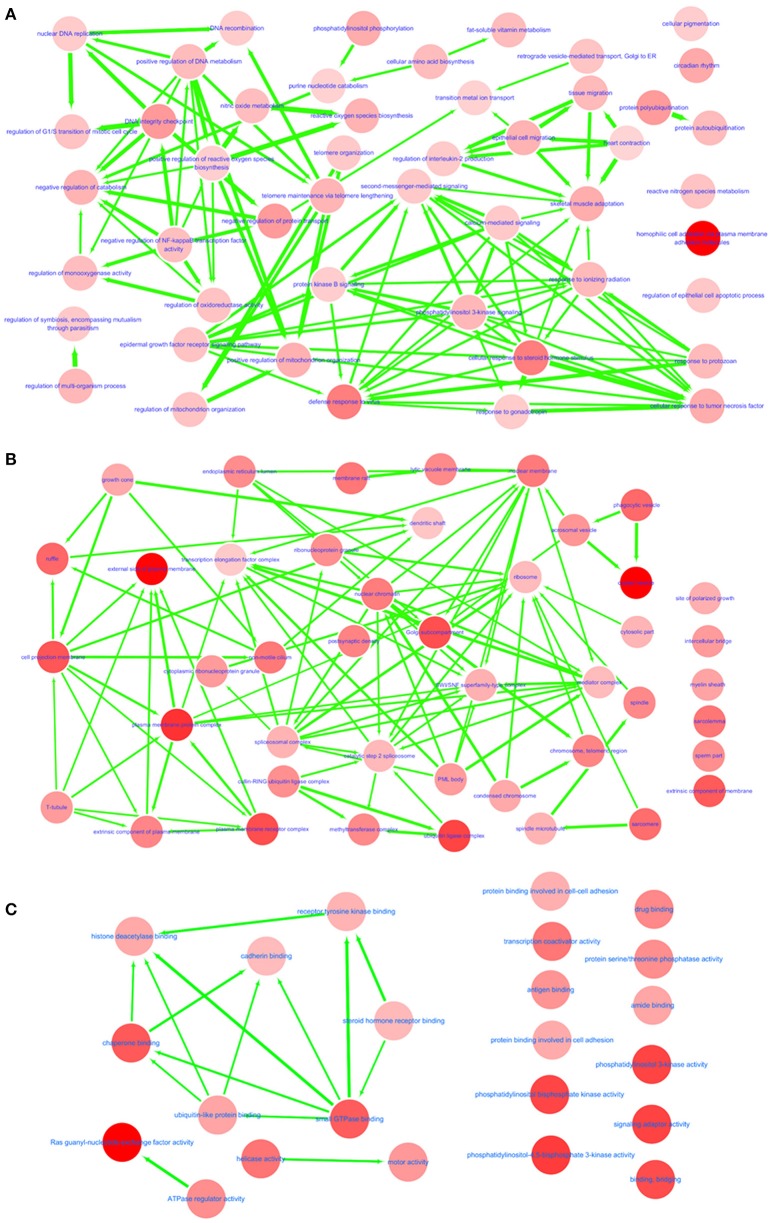
Figure 2.
Interactive networks between MS and IS. Shared and significant biological process (A), cellular component (B), and molecular function (C) from GO function annotation. Bubble color indicates the p-value of each annotation; line width indicates the degree of similarity; arrows represent common affiliations between them.

