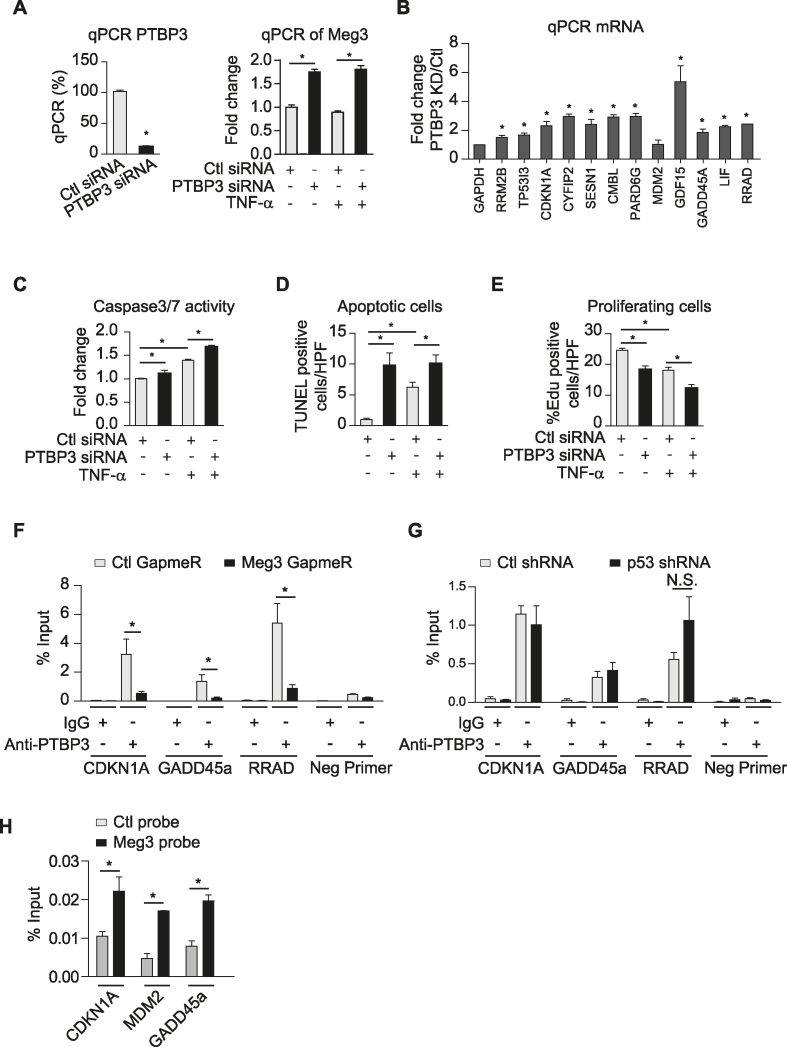
Figure 7.
PTBP3 knockdown phenocopies Meg3′s effects on EC apoptosis and proliferation. HUVECs were transfected with control or PTBP3 siRNAs (A–E), treated with or without TNF-α for 12 or 16 h. HUVECs were transfected with control GapmeRs or Meg3 GapmeRs (F). (A) PTBP3 knockdown by siRNA significantly reduces PTBP3 mRNA. (B) qPCR analysis of a group of p53 target genes in TNF-α-treated HUVECs. (C) Caspase 3/7 activities reflected by luminescence levels were measured, and fold changes were calculated relative to that in ECs transfected with control siRNAs without TNF-α treatment. (D) The number of TUNEL positive cells per high power view were shown. TUNEL positive cells are in red color due to presence of DNA breaks, and DAPI-stained nuclei appear in blue. (E) The percentages of EdU positive cells (red) among Hoechst 33342 (blue) stained cells were calculated in transfected cells with or without 12 h TNF-α treatment. (F) Enrichment of PTBP3 at the promoters of indicated genes was identified by chromatin immunoprecipitation using anti-PTBP3 antibodies followed by qPCR analysis in TNF-α-treated HUVECs transfected with Ctl GapmeRs or Meg3 GapmeRs. (G) Enrichment of PTBP3 at the promoters of indicated genes was identified by chromatin immunoprecipitation using anti-PTBP3 antibodies followed by qPCR analysis in TNF-α-treated HUVECs transduced with lentivirus expressing Ctl shRNA or p53 shRNA. N.S., non-significant. (H) qPCR analysis of CDKN1A, MDM2, and GADD45a promoters after chromatin isolation by RNA purification using control probes or Meg3 probes. Data show mean ± S.E.M., n = 3 or 4 (A–G) or = 2 (H); *P < 0.05.

