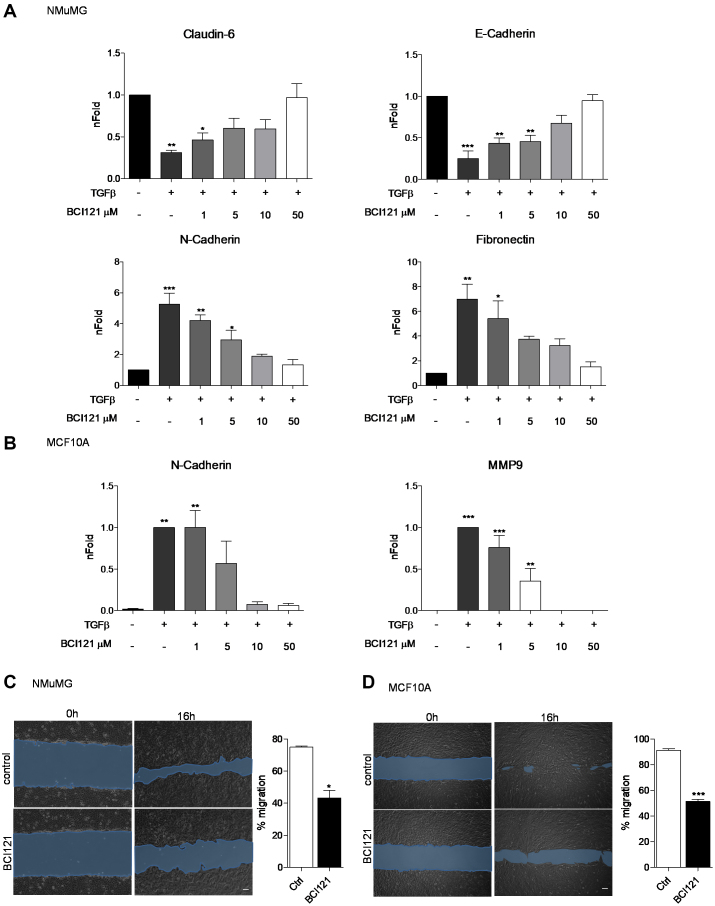
Figure 2.
SMYD3 blockade with the BCI121 inhibitor hampers TGFβ-induced EMT. (A) Epithelial (E-Cadherin, Claudin-6) and mesenchymal (N-Cadherin and Fibronectin) transcripts were quantified by quantitative real-time PCR analysis, relative to GAPDH. NMuMG cells were treated with 10 ng/ml TGFβ in the presence of 0, 1, 5 10 and 50 μM BCI121, for 48 h. Statistical analysis was performed with one-way ANOVA, followed by post-hoc Tukey test. Data represent means±SD. n 3, * P ≤ 0.05, ** P ≤ 0.01, *** P ≤ 0.001. (B) N-Cadherin and MMP9 transcript levels were quantified by quantitative real-time PCR normalized to GAPDH in MCF10A cells treated with 5 ng/ml TGFβ in the presence of 0, 1, 5 10 and 50 μM BCI121 for 48 h. Data represent means±SD. Statistical analysis was performed with one-way ANOVA, followed by post-hoc Tukey test. n
 3, * P ≤ 0.05, ** P ≤ 0.01, ***P ≤ 0.001. (C, D) Wound healing assay on NMuMG and MCF10A cells treated with 10μM BCI121 and 5 and 10 ng/ml TGFβ respectively, for 0 and 16 h. Migration percentage is reported in the right panel. Statistical significance was calculated with paired Student's t-test. * P ≤ 0.05, *** P ≤ 0.001. Scale bar = 10 μm.

