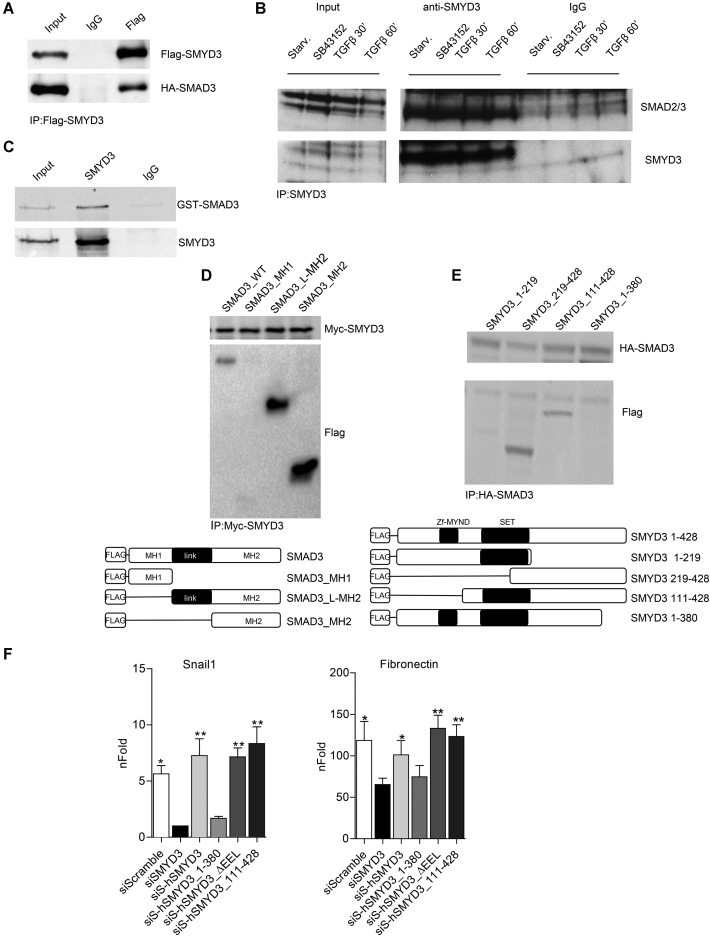
Figure 3.
SMYD3 directly interacts with SMAD3. (A) Western-blot analysis of over-expressed Flag-SMYD3 and HA-SMAD3 following co-immunoprecipitation with anti-Flag antibody. (B) Co-immunoprecipitation analysis of endogenous SMYD3 and SMAD3 in NMuMG cells. Whole cell extract were prepared from NMuMG cells after starvation, from cells treated with the TGFβ-signaling inhibitor SB431542, or starved and treated with 10 ng/ml TGFβ for 30 and 60 minutes. IP was performed with antibodies raised against SMYD3. (C) in vitro co-immunoprecipitation of GST-SMAD3 and SMYD3 was performed with SMYD3 antibodies. Immunoblot was performed with anti-SMAD2/3 and anti-SMYD3 antibodies. (D) Co-immunoprecipitation with anti-Myc antibody in whole cell extracts of HEK293T cells over-expressing Myc-SMYD3 and Flag-SMAD3 WT or Flag-tagged SMAD3 domains MH1, L-MH2 and MH2. Lower panel represents a schematic representation of SMAD3 mutants. (E) Co-immunoprecipitation with anti-HA antibody of HEK293T cells over-expressing HA-SMAD3 and Flag-SMYD3 WT or Flag-tagged SMYD3 mutants 1–219, 219–428, 111–428, 1–380. Lower panel represents a schematic representation of SMYD3 mutant. (F) ΔΔNMuMG cells were transduced with human full-length or SMYD3 mutants by retroviral infection and than knocked down for endogenous SMYD3. 24 h after SMYD3 depletion, cells were treated with 10ng/ml TGFβ for 12 h (Snail1) or 48 h (Fibronectin). Snail1 and Fibronectin transcripts were quantified by quantitative real-time PCR analysis, relative to GAPDH. nFold is relative to siScramble untreated cells. SiS refers to SiSMYD3 cells. Statistical analysis was performed with unpaired Student's t-test. Data represent means ± SD. n = 3, *P ≤ 0.05, **P ≤ 0.01.

