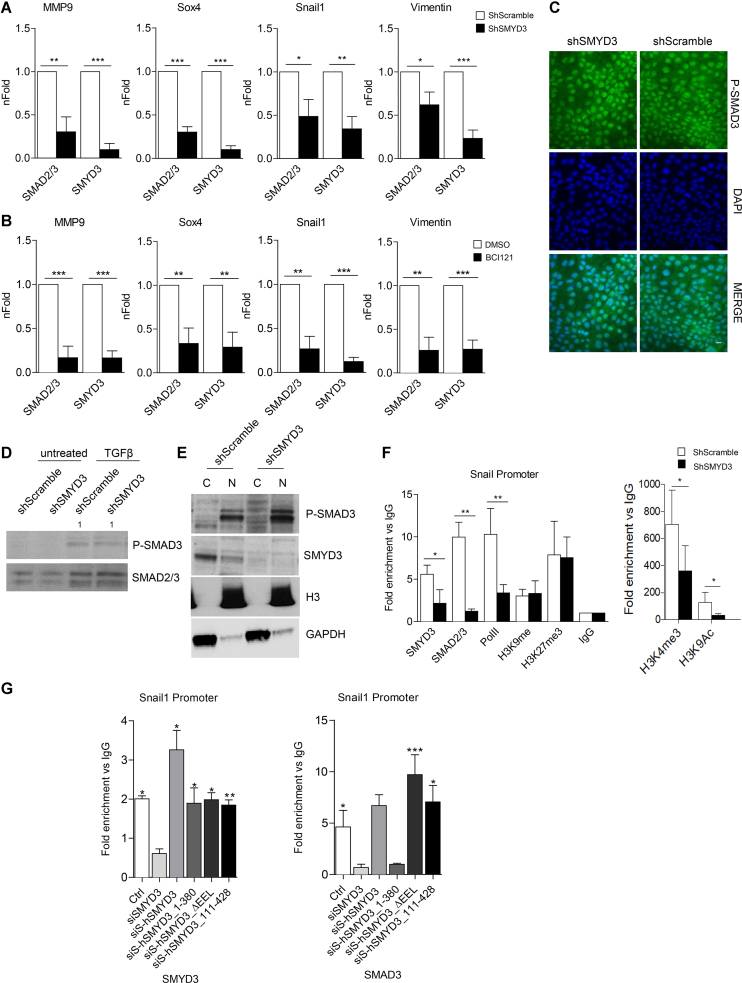
Figure 4.
SMYD3 assists SMAD3 recruitment to the chromatin. (A) SMAD2/3 and SMYD3 association to regulatory regions of EMT markers was analyzed by ChIP qPCR, in ShScramble and ShSMYD3 MCF10A cells treated with 5ng/ml TGFβ for 24 h. Data are expressed as fold enrichment relative to ShScramble cells and represent means±SD. Statistical analysis was performed with Student's t test. n = 4, * P ≤ 0.05, ** P ≤ 0.01, *** P ≤ 0.001. (B) SMAD2/3 and SMYD3 association to EMT markers was analyzed by ChIP qPCR, in MCF10A cells co-treated with 5ng/ml TGFβ and 10 μM BCI121 for 24 h. Data are expressed as fold enrichment relative to control cells. Data represent means±SD. Statistical analysis was performed with unpaired Student's t test. n = 4, * P ≤ 0.05, ** P ≤ 0.01, *** P ≤ 0.001. (C) immunofluorescence microscopy of shSMYD3 or shScramble NMuMG cells treated with 10 ng/ml TGFβ for 2 h. The staining for the phosphorylated SMAD3 (P-SMAD3) (left panel), for DAPI (center panel) and the merge of the two stainings (right panel) are shown. Scale bar = 10 μm. (D) Western-blot analysis of P-SMAD3 and SMAD2/3 levels in shSMYD3 or shScramble NMuMG cells, treated with 10 ng/ml TGFβ for for 30 min. Relative band intensity, normalized over total SMAD2/3 proteins, is indicated. (E) Western-blot analysis of cytoplasmic (C) and nuclear (N) P-SMAD3 in shSMYD3 or shScramble NMuMG cells treated with 10 ng/ml TGFβ for 30 min. GAPDH was used as cytoplasmic marker, histone H3 as nuclear marker. (F) ChIP assay was performed to evaluate SMYD3, SMAD2/3, RNAPolII, H3K9me3, H3K9Ac, H3K27me3 occupancy at the Snail1 promoter, in NMuMG cells treated with 10ng/ml TGFβ for 6 h. Data are normalized on IgG and represent means ± SD. Statistical analysis was performed with Student's t test. n = 3, * P ≤ 0.05, ** P ≤ 0.01. (G) ChIP assay was performed to evaluate SMYD3 and SMAD2/3 occupancy at the Snail1 promoter, in NMuMG cells obtained as in Figure 3F, treated with 10ng/ml TGFβ for 6 h. SiS refers to SiSMYD3 cells. Data are normalized on IgG and represent means±SD. Statistical analysis was performed with unpaired Student's t test. n = 3, * P ≤ 0.05, ** P ≤ 0.01, *** P ≤ 0.001.

