Figure 5.
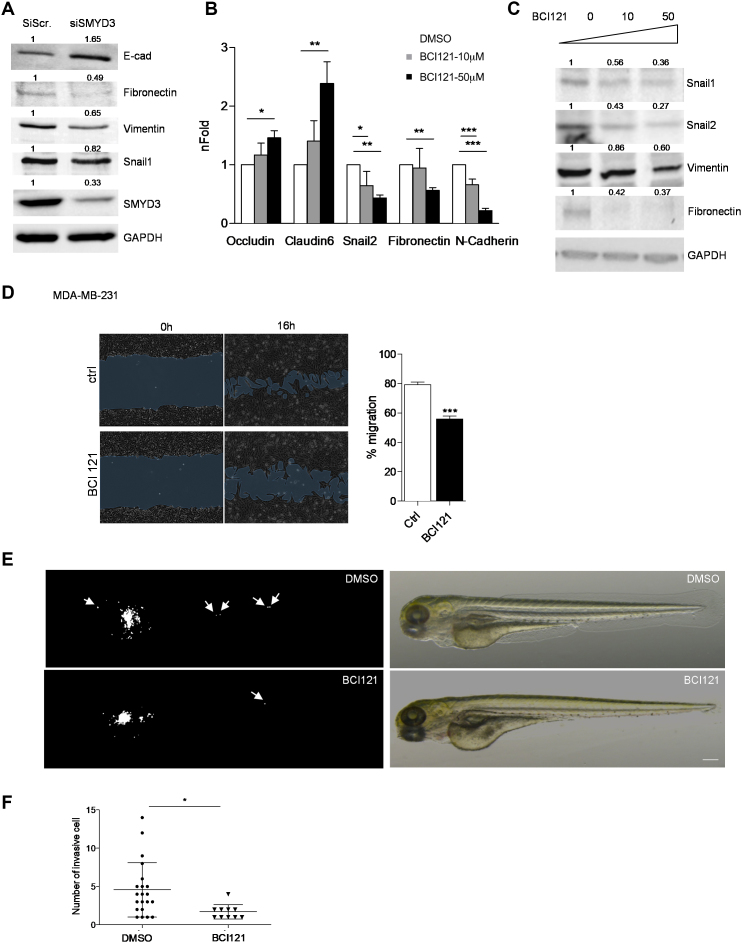
SMYD3 knock down or pharmacological blockade tempers MDA-MB-231 mesenchymal phenotype and migration ability. (A) SMYD3 was knocked down by siRNA transfection in MDA-MB-231 cells, total extracts were collected after 48 h and assayed for epithelial (E-cad) or mesenchymal (Fibronectin, Vimentin and Snail1) protein levels by immunoblot. GAPDH was used as a loading control. nFold is relative to DMSO treated cells. (B) MDA-MB-231 cells were treated with increasing doses of BCI121 (0, 10 or 50 μM) for 48 h. Epithelial (Occludin, Claudin6) or mesenchymal (Snail2, N-cadherin and Fibronectin) marker mRNA levels were measured by qRT-PCR. GAPDH was used as housekeeping gene. Data represent means±SD. Statistical analysis was performed with 1 way ANOVA, followed by post-hoc Tukey test n 3, * P ≤ 0.05, ** P ≤ 0.01, *** P ≤ 0.001. (C) MDA-MB-231 cells were treated with increasing doses of BCI121 (0, 10 or 50 μM) for 72 h and whole cell extracts were assayed for mesenchymal (Snail1, Snail2, Vimentin and Fibronectin) protein levels by immunoblot. GAPDH was used as a loading control. (D) Wound-healing assay on MDA-MB-231 cells treated with 10 μM BCI121 for 0 and 16 h. Migration percentage is reported in the right panel. Statistical significance was calculated with Student's t-test. *** P ≤ 0.001. Scale bar = 10μm. (E) in vivo migration assay in zebrafish xenografts. 1 × 10² MDA-MB-231 cells were injected in the subepidermal pocket of zebrafish embryos at 48 hpf. Embryos were treated with 50 μM BCI-121 or DMSO, for 48 h, n = 14 DMSO embryos, n = 12 BCI121 embryos. (F) Cells migrating in the tail, heart and head were counted in the two groups, 48 hpi. Scale bar = 200μm. Statistical analysis was performed with unpaired Student's t-test. * P ≤ 0.05. Normalized band intensity in immunoblots is reported above signals.

