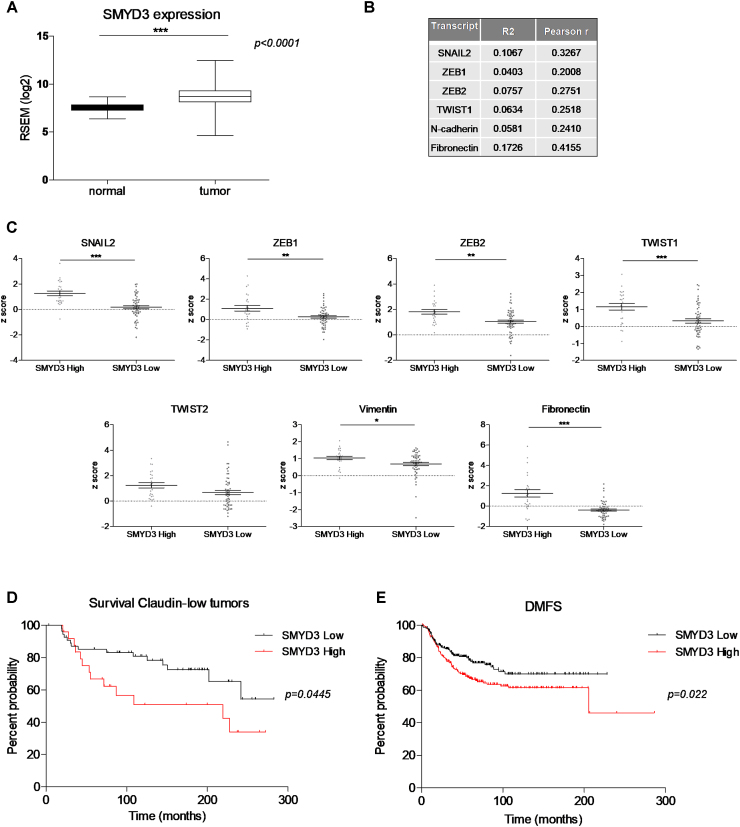
Figure 6.
Prognostic value of SMYD3 in breast cancer. (A) Box plots showing SMYD3 expression levels in normal and tumor breast tissues. Analysis was performed on 1098 breast cancer tissues and 112 normal tissues on TCGA data, downloaded through Firebrowse. *** P < 0.0001, unpaired Student's t test. (B) Correlation between SMYD3 and the mesenchymal markers Snail2, ZEB1, ZEB2, TWIST1, Fibronectin and N-Cadherin expression, calculated on claudin-low tumors (Metabric), by Pearson correlation analysis. Pearsons’ coefficient tests were performed to assess statistical significance. (C) Claudin-low tumors (Metabric) were stratified for SMYD3 expression (high vs low) and Snail2, ZEB1, ZEB2, TWIST1, TWIST2, Vimentin, Fibronectin mRNA levels were compared in SMYD3 low and SMYD3 high tumors. Statistical significance was calculated with unpaired Student's t test. *P ≤ 0.05, **P ≤ 0.001, ***P ≤ 0.0001. (D) Kaplan–Meier plots of survival probability of claudin-low patients stratified by SMYD3 expression in the Metabric dataset. P value calculated by log rank test. (E) Kaplan–Meier plots of distant metastasis-free survival of patients with grade 3 tumors, stratified by SMYD3 expression levels. P value was calculated by log rank test.

