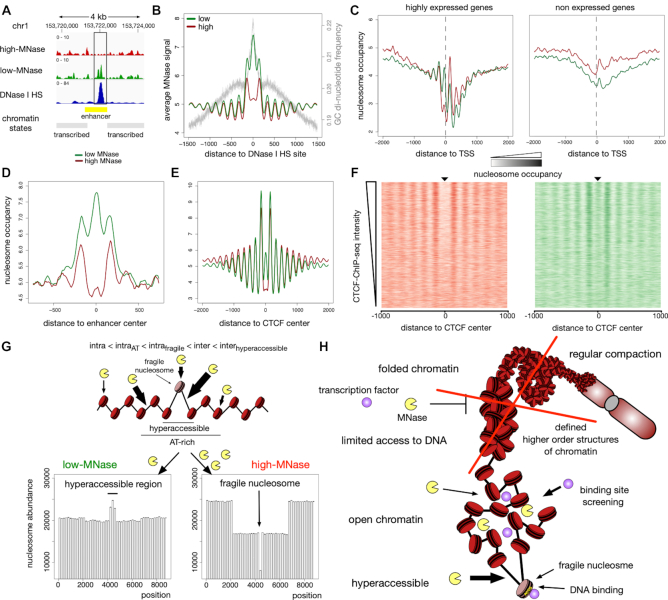
Figure 5.
Differences of low- and high-MNase analysis at local sites. (A) Genome browser snapshot around an accessible enhancer marked by DNase I HS peak (ENCODE, ENCFF567PRQ). (B–E) Averaged MNase-seq profiles around: (B) DNase I HS sites (ENCODE, ENCFF692NCU); average G/C—di-nucleotide content is indicated by the grey line. (C) TSS of highly expressed genes (left panel) and not expressed genes (right panel). FPKM values determined by RNA-Seq analysis (ENCODE, ENCFF000DNW) were used to estimate the level of gene expression. Genes not detected in RNA-Seq analysis (FPKM = 0) were considered as not expressed and those genes showing the 25% highest FPKM values were considered as highly expressed. (D) Active enhancer sites in HeLa cells as defined in (49). (E) CTCF sites (ENCODE, ENCFF002DCW). (F) Heatmaps of high-MNase (left panel) and low-MNase (right panel) are centred on CTCF binding sites and sorted in descending order of ChIP-Seq density at detected CTCF sites. (G) Simulation of low- and high-MNase digestions of a nucleosome array exhibiting nucleosomes with variable MNase sensitivity and hyper-accessible DNA sites. A higher intra-nucleosome cleavage probability pcut(nuc, AT+) was assigned to a domain, simulating an AT-rich region in the middle of the chromatin strand. In the centre of the nucleosomal array an hyper-accessible site was introduced, representing a fragile nucleosome with markedly increased intra-nucleosome cleavage probability pcut(nuc, fragile), and the two adjacent DNA linker sites were assigned with enhanced inter-nucleosomal cleavage probability pcut(linker, hyperaccessible). Chosen cleavage probabilities: pcut(nuc, AT+) = 2·pcut(nuc), pcut(nuc, fragile) = 4·pcut(nuc), pcut(linker) = 10·pcut(nuc), pcut(linker, hyper-accessible) = 12·pcut(nuc). (H) Schematic model summarising the results of this study.

