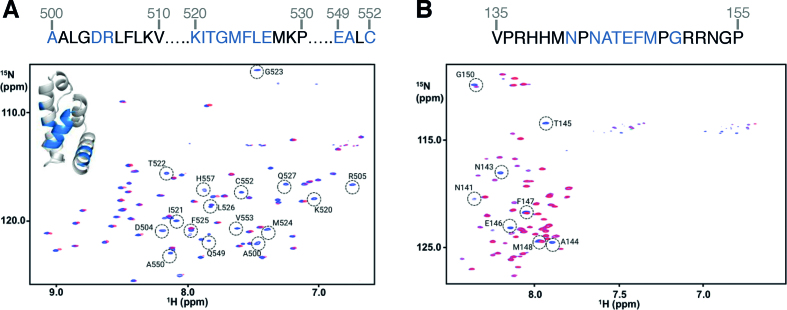
Figure 2.
NMR spectra reveal interacting residues and conformational changes. (A) 1H–15N HSQC spectra of 15N,13C-labelled PABP1(J) in the absence (blue) and presence (red) of unlabeled eIF4E4(iv), with residues undergoing chemical shift perturbations (CSPs) upon binding highlighted. (B) The equivalent experiments were performed using 15N–13C-eIF4E4(iv) plus unlabelled PABP1(J). The residues affected by binding are also highlighted in the sequence for PABP1 (blue highlighted amino acids at the top of panel A) and in the sequence for eIF4E4 (blue highlighted residues at the top of panel B).

