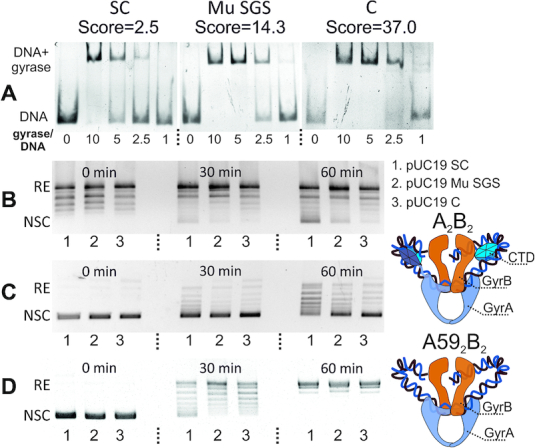
Figure 5.

DNA gyrase behavior depends on a DNA substrate gyrase binding score. (A) EMSA analysis of DNA gyrase binding with 133 bp fragments; fragments scores are showed above the pictures; molar gyrase/DNA ratio is indicated under the lanes. SC—scrambled consensus, C—consensus. (B) Time-course of gyrase supercoiling of pUC19 plasmids harboring indicated 133 bp fragments; RE—relaxed plasmid, NSC—negatively supercoiled plasmid. 1—scrambled consensus, 2—Mu SGS, 3—consensus. (C) Time-course of ATP-independent relaxation of pUC19 plasmids harbouring indicated 133 bp fragments. (D) Time-course of ATP-dependent relaxation of the same plasmids by truncated GyrA592GyrB2 gyrase lacking CTD.
