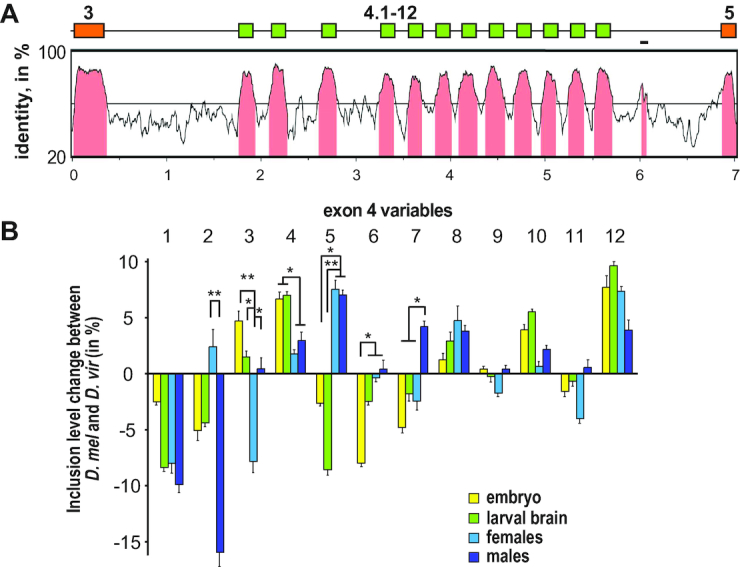
Figure 4.

Phylogenomic analysis of the Dscam exon 4 cluster. (A) Vista plot alignment of Dscam exons 3 to 5 of the D. melanogaster sequence compared to the D. virilis sequence. Exons are shown as boxes on top and indicated in pink on the alignment. The line in intron 4.12 indicates the sequence assigned docking site by Yang et al. (47). (B) Developmental profile of differences in inclusion levels of exon 4 variables in embryos (yellow), third instar larval brains (green), adult females (dark blue) and males (light blue) of D. melanogaster compared to D. virilis shown as means with standard error from three experiments. Statistically significant differences are indicated above bars (*P < 0.05, **P < 0.01).
