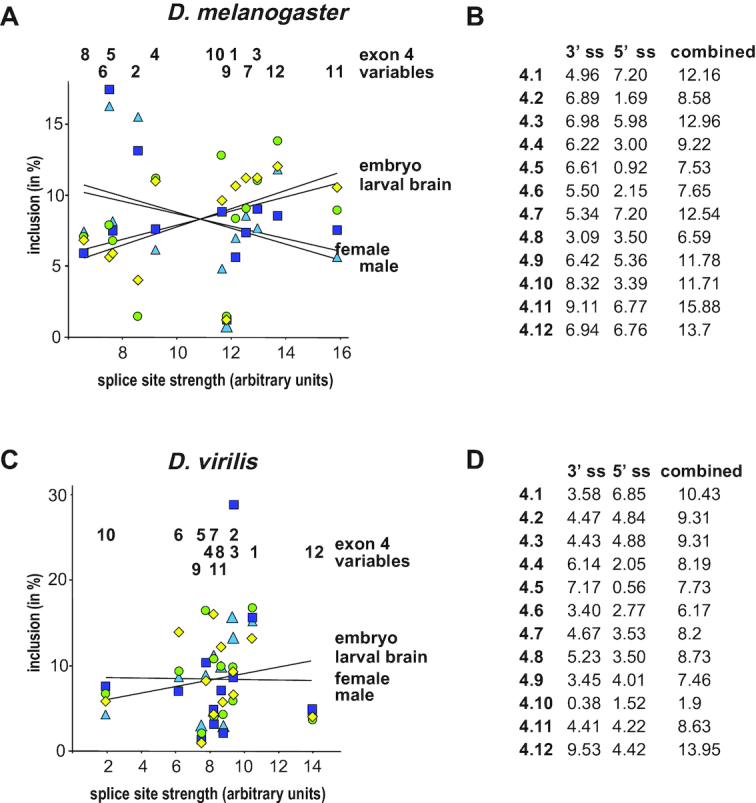
Figure 5.

Splice site strength of Dscam exon 4 variables does not correlate with inclusion levels. (A) Splice site strength of D. melanogaster exon 4 variables are plotted against the mean of inclusion levels from three experiments during development (embryos in yellow and third instar brains in green) or in adult females (dark blue) and males (light blue). Trends for different samples are indicated as lines. (B) Scores for 5′, 3′, and combined splice sites for Dscam exon 4 variables from D. melanogaster. (C) Splice site strength of D. virilis exon 4 variables are plotted against the mean of inclusion levels with standard error from three experiments during development (embryos in yellow and third instar brains in green) or in adult females (dark blue) and males (light blue). Trends for different samples are indicated as lines. (D) Scores for 5′, 3′, and combined splice sites for Dscam exon 4 variables from D. virilis.
