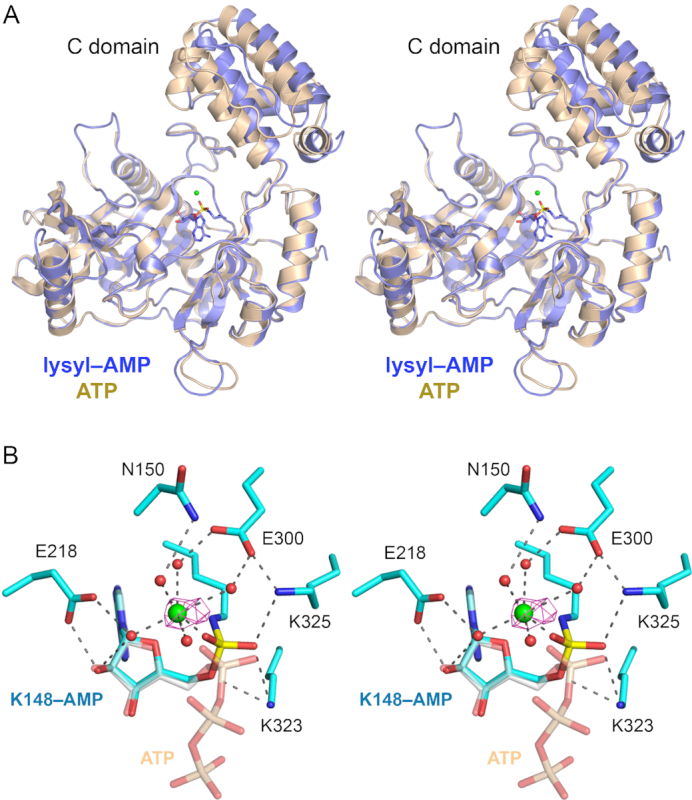
Figure 5.

Trl1-LIG–AMP covalent intermediate. (A) Stereo view of the tertiary structures of the Tr1LIG–AMP intermediate (in blue) and the LIG–ATP Michaelis complex (in beige) superimposed with respect to their N-terminal adenylyltransferase domains. The image highlights a rigid body movement of the C-terminal domain in the transitions from LIG•ATP to LIG–AMP. The lysyl-adenylate adduct in the LIG–AMP structure is shown as a stick model. The catalytic Mn2+ ion is rendered as a green sphere. (B) Stereo view of the active site of LIG–AMP. Amino acids and lysyl–AMP are shown as stick models with cyan carbons; the AMP phosphorus atom is colored yellow. A catalytic Mn2+ ion and associated waters are depicted as green and red spheres, respectively. The anomalous difference peak overlying the manganese ion, contoured at 4σ, is depicted in magenta mesh. Atomic contacts are indicated by dashed lines. The superimposed ATP from the Michaelis complex structure is shown as a semi-transparent stick model with gray carbons and beige phosphorus atoms (to highlight the stereochemical inversion of the α phosphorus center after lysine adenylylation).
