Figure 3.
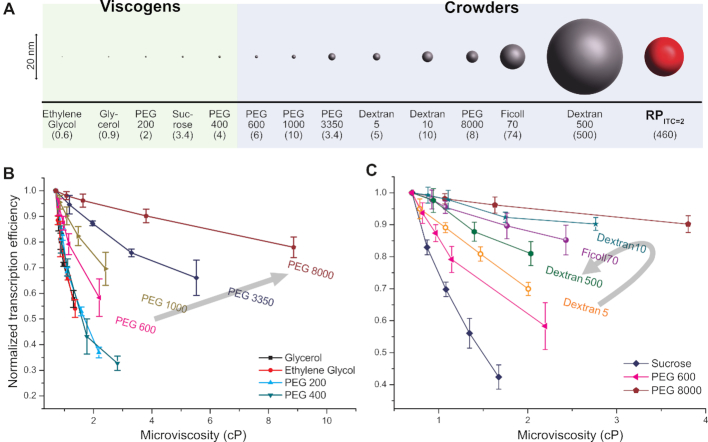
Normalized transcription efficiencies (at a single time point, tincubation = 900 s) for different crowding conditions, as a function of microviscosity. (A) Sizes of crowders used in this study. The sizes of crowders are listed in Supplementary Table S1 and RPITC=2 size (RH, 8.1 nm) was estimated by FCS measurements (see Supplementary Data for details). The average molecular weights (in kDa) appear in the parentheses. (B andC) Transcription efficiencies measured by single-time-point-transcription quenched-kinetics assays for various sizes of PEGs (B) and for Dextran and Ficoll (C). Transcription efficiency values are normalized to the reaction without crowders (buffer only). Error bars represent standard deviations of triplicate runs. Lines are guides to the eye. The black arrows in (B) and (C) indicate the direction of increase in the crowder size.

