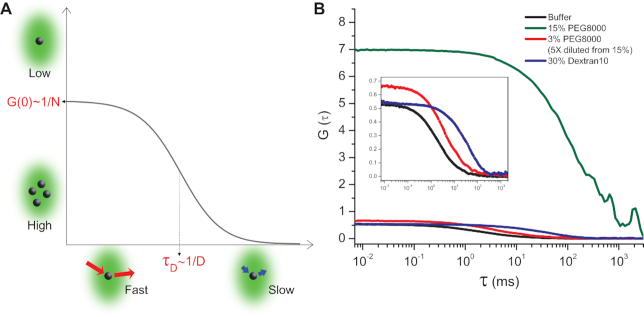
Figure 5.
FCS measurements show that RNAP–Promoter complexes could form reversible aggregates in the presence of PEG8000. (A) A schematic of a fluorescence correlation curve for a single species in a solution. The amplitude of the correlation curve extrapolated to zero time delay (i.e. G(0)) is inversely proportional to the mean number of fluorescent molecules in the detection volume. The characteristic resident time in the detection volume τD is inversely proportional to the diffusion coefficient of the molecules. (B) FCS curves for RPITC=2 in buffer (black), 15% PEG8000 (olive), 3% PEG8000 (red) obtained from 5× dilution of 15% PEG8000 whose correlation curve is shown in olive, 30% Dextran10 (blue). Zoomed-in curves for buffer (black), 3% PEG8000 (red) and 30% Dextran10 (blue) are shown in the inset.

