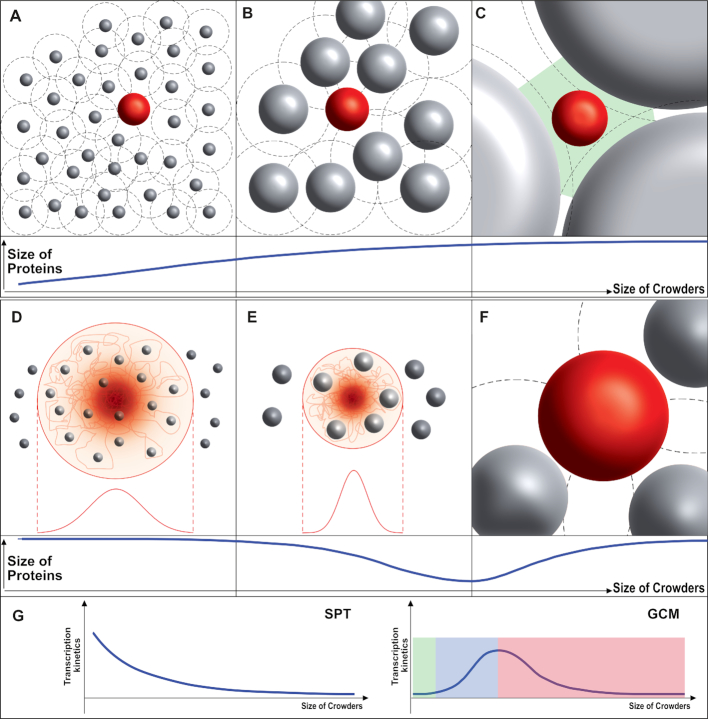
Figure 6.
The effect of crowding according to the SPT (top) and GCM (bottom). (A–C, top) The SPT-based hard-sphere model predicts that an unfolded protein chain (red sphere) in the presence of macromolecular crowding becomes less compact as the size of crowder (gray spheres) increases. (A) When the size of a crowder is small compared to the size of the protein, the excluded volume (the volume not accessible to the protein chain, black-dashed circle) is much larger than the volume fraction of the crowder. This leads to the compaction of the protein. (B) As the size of the crowder increases, the excluded volume approaches the volume of the crowder, resulting in less compaction (compared to a smaller crowder at the same volume fraction). (C) When the size of the crowder is much larger than the protein, interstitial cavities (green area) can accommodate the unfolded protein chain without compaction so that it will have the same size (or same protein conformation) as in buffer. (D–F, bottom) GCM predicts a non-monotonic trend for the size of a protein chain under crowding. (D) A crowder smaller than a given (lower-threshold) size would seldom affect the size of the protein (since it permeates the chain, red line). (E) As the crowder size increases (above the lower threshold), less volume would be available for the protein chain (red line) since the chain cannot occupy the same volume as the rigid crowders (gray sphere) in the protein cloud. This induces a compaction of the protein. (F) As the size of the crowder increases further, the GCM eventually turns into the SPT (i.e. the crowder is no longer in the cloud of protein residues). (G) With the hypothesis that folded/compacted structure enhances the transcription kinetics, SPT predicts monotonic decrease in enhancement of transcription kinetics and eventually no effect as the size of crowder increases while GCM predicts (i) marginal effect when crowder’s size is smaller than the lower threshold (highlighted in green), (ii) increase in the enhancement with increasing size when the size is in between lower and upper threshold (highlighted in blue), (iii) decrease in the enhancement and eventually no effect as seen in SPT model when the size is larger than upper threshold (highlighted in red).

