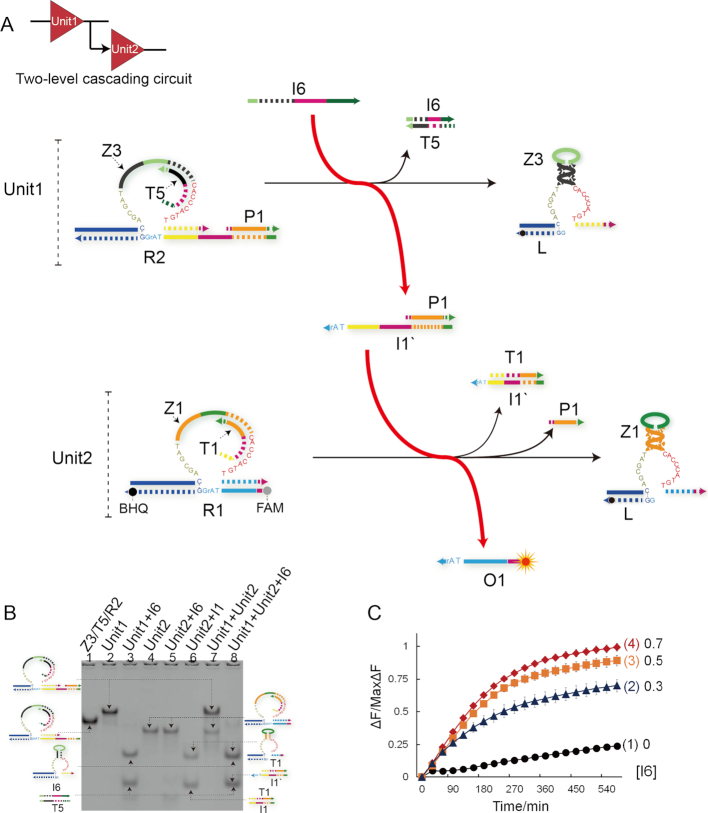
Figure 3.
(A) Illustration of two-level cascading circuit. The fluorophore FAM and the quencher BHQ are functionalized at either end of substrate strand R1. (B) Native PAGE analysis of two-level cascading circuit products. Lane 1, DNA complex Z3/T5/R2; lane 2, Unit1 complex Z3/T5/R1/P1; lane 3, products of Unit1 triggered by input I6; lane 4, Unit2 complex Z1/T1/R1; lane 5, products of Unit2 in presence of input I6; lane 6, products of Unit2 triggered by input I1; lane 7, mixture of Unit1 complex and Unit2 complex; lane 8, products of two-level cascading circuit consisting of Unit1 and Unit2 triggered by input I6. (C) Time-dependent normalized fluorescence changes (ΔF/MaxΔF) at different levels of input concentrations. The sample interval was 6 min. Curves (1) to (4) demonstrate the cascading circuit responses at different concentrations of I6 as 0, 0.3, 0.5, 0.7 μM, respectively. All data represent the average of three replicates. Error bars represent one standard deviation from triplicate analyses.

