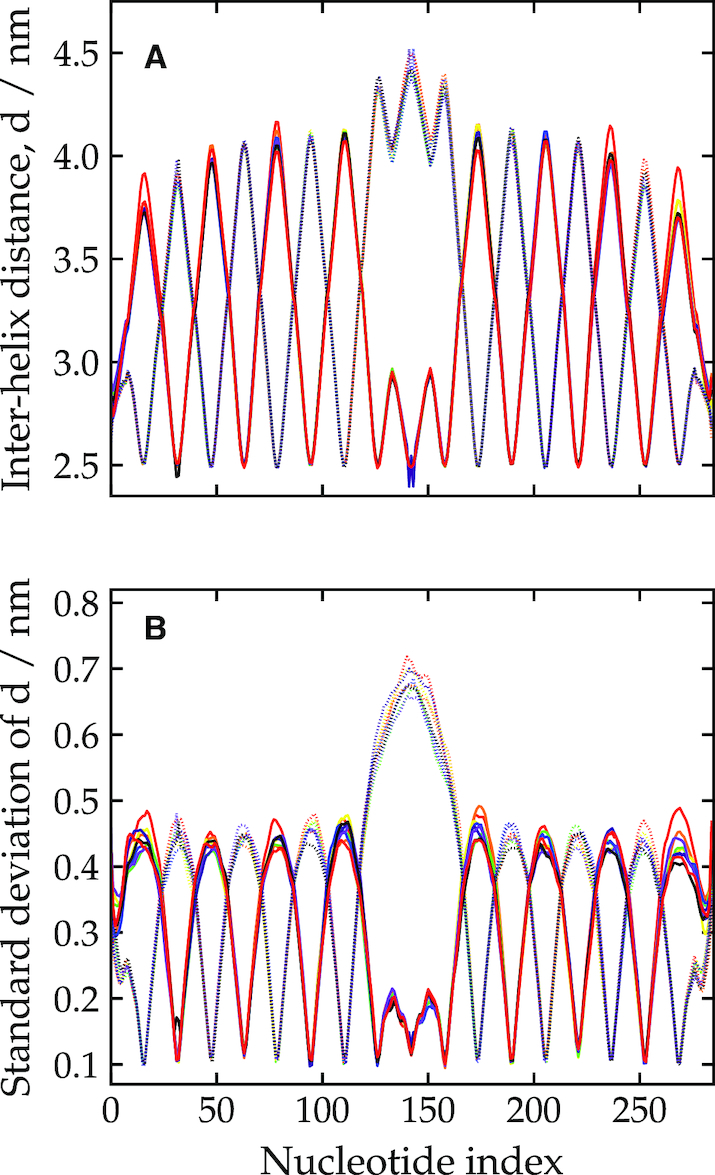
Figure 3.

The weave pattern for the 2D tile at 300 K and [Na+] = 0.5 M, quantified by (A) the inter-helix distance and (B) the standard deviation in this distance as a function of base-pair index along the origami. Each line corresponds to a different pair of adjacent double helices on the origami. Some pairs have been omitted for clarity (see main text). The symmetry of the design is such that the pairs may be split into two groups: here one group is plotted with solid lines and one with dotted lines.
