Figure 2.
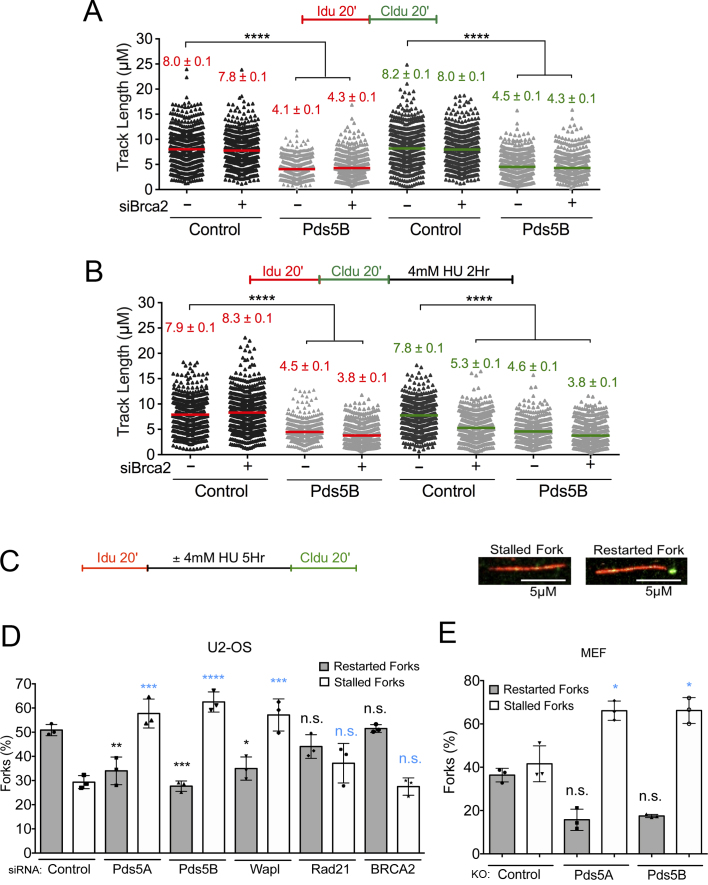
The role of Pds5 in replication fork progression is uncoupled from BRCA2 and compromises fork restart upon prolonged HU treatment. (A, B) Size distribution of IdU and CldU tract length in Pds5B, BRCA2 and Pds5B/BRCA2 siRNA depleted U-2 OS Cells. Untreated cells (A) and HU treated cells (B). Bars represent the mean. Out of two repeats; n ≥ 300 tracts scored for each data set. Statistics: Mann–Whitney; ****P < 0.0001. (C) Single-molecule DNA fiber labeling scheme used for the fork restart experiments and representative images of stalled and restarting forks. Scale bar 5 μm. (D) Quantification of stalled/terminated forks and restarting forks after HU treatment in control, Pds5A, Pds5B, Wapl and Rad21, BRCA2 siRNA depleted U-2 OS cells. Out of three repeats, the percentage is established on at least 1000 tracts scored for each data set. Data are represented as mean ± SD. Statistics: two-way ANOVA. P values, restarted forks: siControl versus siPds5A **P = 0.0088; siControl versus siPds5B ***P = 0.0010; siControl versus siWapl *P = 0.0127; siControl versus siRad21 ns, P = 0.3881; siControl versus siBRCA2 ns, P = 0.9998. Stalled forks: siControl versus siPds5A ***P = 0.0002; siControl versus siPds5B ****P < 0.0001; siControl versus siWapl ***P = 0.0002; siControl versus siRad21 ns, P = 0.2757; siControl versus siBRCA2 ns, P = 0.9878. ns, not significant. (E) Quantification of stalled/terminated forks and restarting forks in WT, Pds5A, and Pds5B knockout MEF cells. Out of three repeats, the percentage is established on at least 1000 tracts scored for each data set. Data are represented as mean ± SD. Statistics: two-way ANOVA. P values, restarted forks: siControl versus siPds5A *P = 0.0474; siControl versus siPds5B ns, P = 0.0617. Stalled forks: siControl versus siPds5A *P = 0.0273; siControl versus siPds5B *P = 0.0269. ns, not significant.

