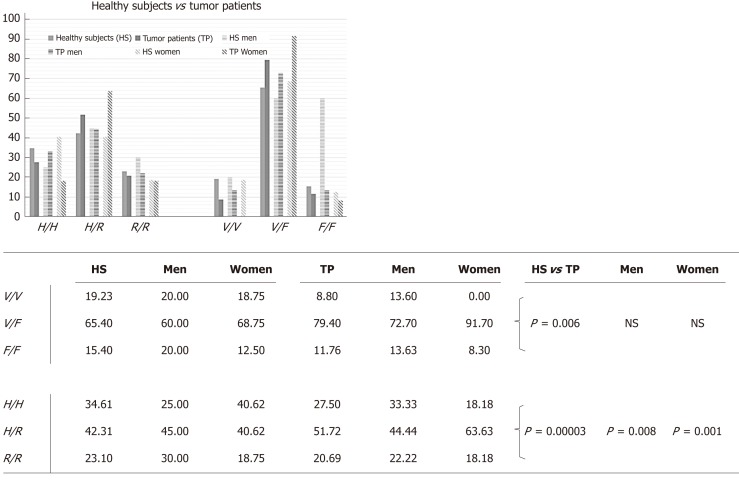
Figure 5.
FcγRIIa and FcγRIIIa polymorphism frequencies in healthy subjects and tumor patients. Values are expressed as percentages. The statistical data were obtained by using goodness-of-fit statistic. Values of P < 0.05 were considered significant. NS: Not significant; HS: Healthy subject; TP: Tumor patients.

