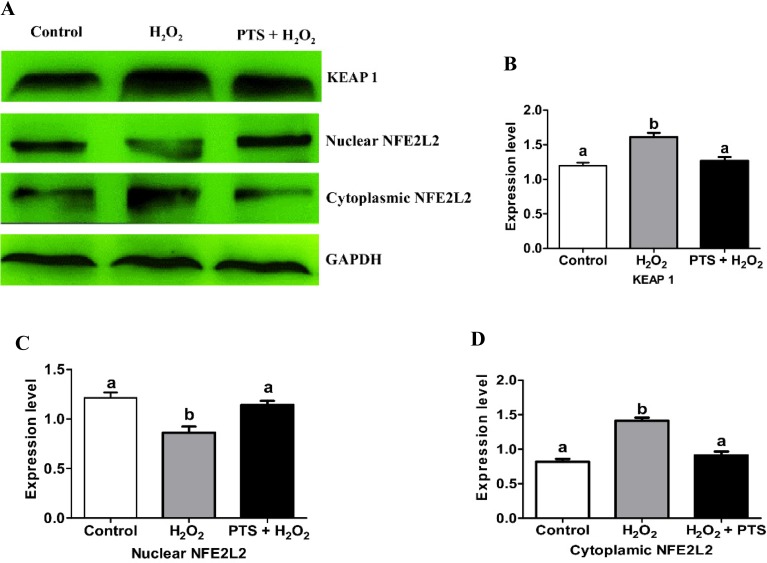
Fig. 3.
Effect of PTS treatment on NFE2L2 and KEAP1 proteins expressions in mouse embryo cultured in the different treated group. (A) Western blot results of KEAP1, nuclear and cytoplasmic NFE2L2 protein expressions in the mouse blastocyst. (B) Relative expression of KEAP1, nuclear, and cytoplasmic NFE2L2 normalized with the internal marker GAPDH (P < 0.05). Data are expressed as a mean value ± standard error of the mean (SEM) of three independent experiments. ab Values with different superscripts in the same column were significantly different (P < 0.05).

