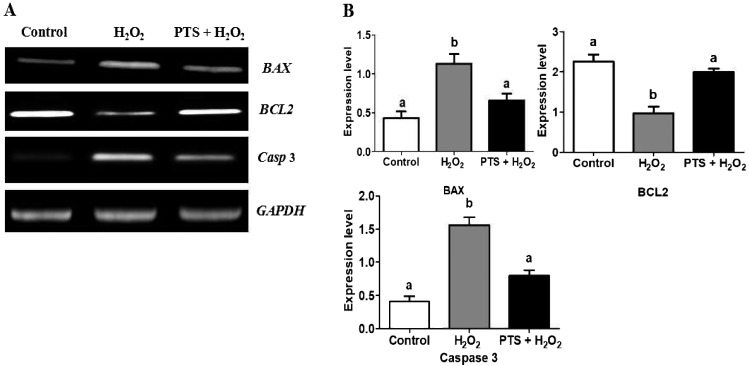
Fig. 5.
Effect of PTS treatment on BCL2, BAX, and Caspase-3 genes expressions in mouse embryo cultured in the different treated group. (A) PCR results of BCL2, BAX, and Caspase-3 expressions in control and treated groups in mouse embryos. (B) Relative changes of BCL2, BAX, and Caspase-3 normalized with the internal marker GAPDH (P < 0.05). Data are expressed as a mean value ± standard error of the mean (SEM) of three independent experiments. ab Values with different superscripts in the same column were significantly different (P < 0.05).

