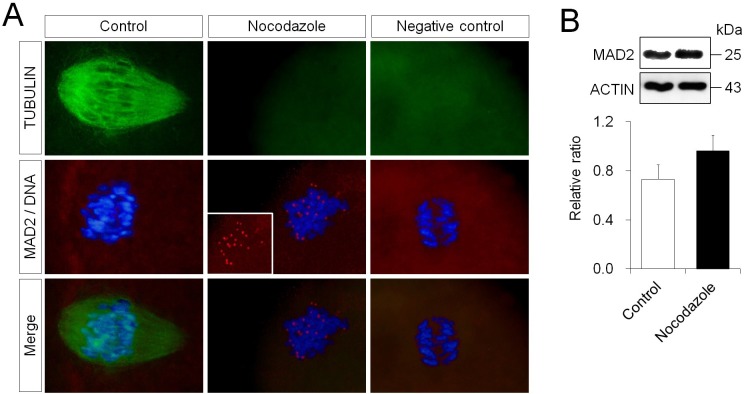
Fig. 4.
Localization and expression level of MAD2 in fresh mouse oocytes with blocked microtubule polymerization. (A) Immunofluorescent staining of MAD2 (red) and α-tubulin (green). DNA (blue) was stained with DAPI. D-PBS, instead of the primary antibody, was used as the negative control. The inserted panel in the middle panel of the nocodazole group indicates only MAD2 signals. Scale bar = 10 μm. (B) Western blotting and expression levels of MAD2 in oocytes treated with nocodazole. β-actin was used as a loading control.

