Fig. 5.
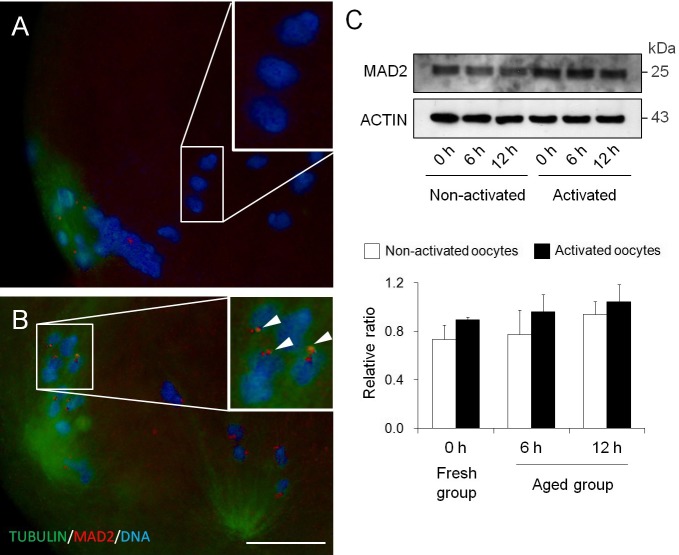
Localization and expression level of MAD2 in mouse post-ovulatory aged oocytes. (A, B) Immunofluorescent staining of MAD2 (red) and α-tubulin (green) in 12 h aged oocytes. DNA (blue) was stained with DAPI. (A) No signal of MAD2 on the misaligned chromosome. (B) MAD2 localization on the chromosome, despite spindle fiber connections to kinetochores. The white arrowheads indicate MAD2 localization at the chromosome kinetochore. Scale bar = 10 μm. (C) Western blotting and expression levels of MAD2 in aged oocytes.

