Fig. 1.
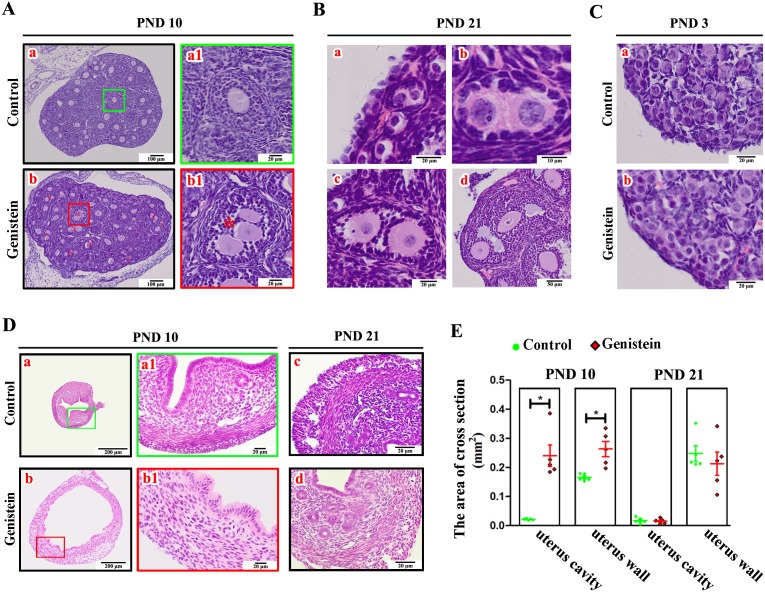
Effects of exposure to 100 mg/kg genistein on ovarian and uterine development. A) Ovarian histological organization after consecutive subcutaneous genistein injections for 10 days. a and b are the representative sections of ovaries from control mice and neonatal genistein-treated mice, respectively; a1 and b1 are the partially magnified drawings of a and b, respectively. The red “*” in b represents MOFs. B) Different stages of MOFs in ovaries from mice at PND 21. a is primordial MOFs; b is primary MOFs; c is secondary MOFs; and d is antral MOFs. C) Ovarian histological organization after consecutive subcutaneous genistein injections for 3 days. a and b are the representative sections of ovaries from the control mice and neonatal genistein-treated mice, respectively. D) Uterine histological organization in mice at PND 10 and PND 21. a–a1 and b–b1 are the representative sections of uteri from control mice and neonatal genistein-treated mice at PND 10, respectively; c and d are the representative sections of uteri from controls and neonatal genistein-treated mice at PND 21. E) The cross-sectional area of the uterine cavity and uterine wall in mice at PND 10 (n = 5) and PND 21 (n = 5). Results are shown as mean ± SEM and statistical differences were determined by ANOVA. The green spot indicates the control, red prismatic points indicate genistein treatment, and “*” indicates a significant difference between controls and genistein treatment (P < 0.05).

