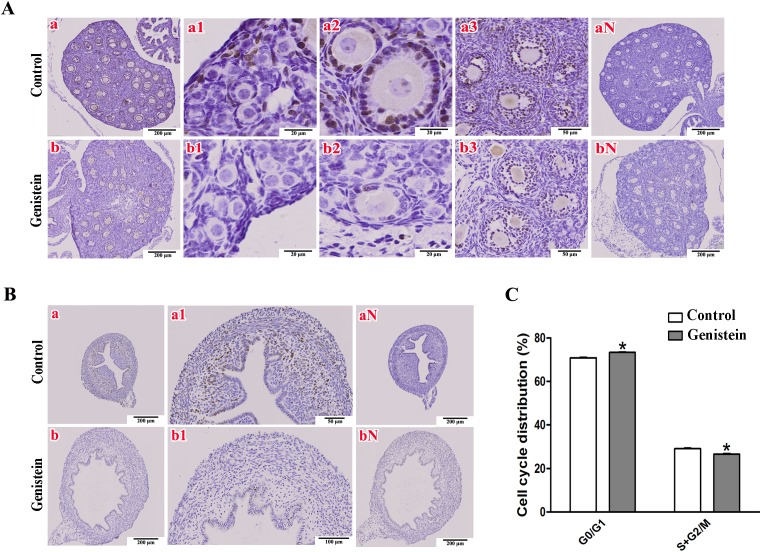
Fig. 2.
Immunohistochemical staining of Ki67 proteins in ovaries and uteri from mice at PND 10 following 100 mg/kg genistein exposure for 10 consecutive days. A) The representative sections of Ki67 location in ovaries. a and b are the global distribution of Ki67-positive nuclei, a1 and b1 are the Ki67 locations in primordial follicles, a2 and b2 are the Ki67 locations in primary follicles, a3 and b3 are the Ki67 locations in secondary follicles, and aN and bN are negative controls for the elimination of non-specificity. B) The representative sections of Ki67 locations in uteri. a and b are the global distributions of Ki67-positive nuclei, a1 and b1 are the Ki67 locations in myometrium, and aN and bN are negative controls for non-specificity. C) Effect of genistein on ovarian follicle granulosa cell cycle progression. The percentages of G0/G1, S, G2/M were obtained by flow-cytometric analysis (*P < 0.05, n = 6, vs. control).

