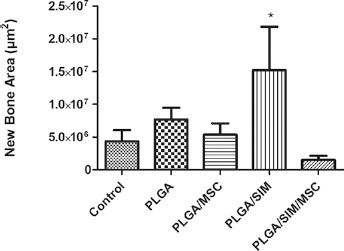
Fig. 7.

Bar graph of areas of newly formed bone after 8 weeks of implantation. Results are expressed as medians and standard deviation. All groups were compared to control (∗p<0.01, vs control). MSC = mesenchymal stem cell; PLGA = poly(lactic-co-glycolic acid); SIM = simvastatin.
