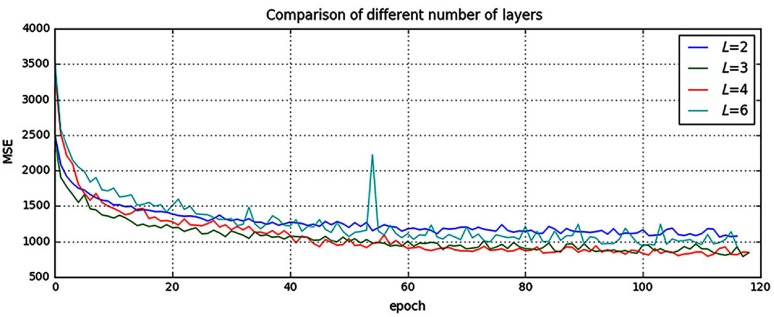
Fig. 3.
Comparison of different number of layers. Shown are learning curves for different number of layers (). As the network goes deeper, the result can be increased. However, deeper structure cannot always lead to better results, sometimes even worse. (Note: for interpretation of the references to color in this figure legend, the reader is referred to the online version of this article.)

