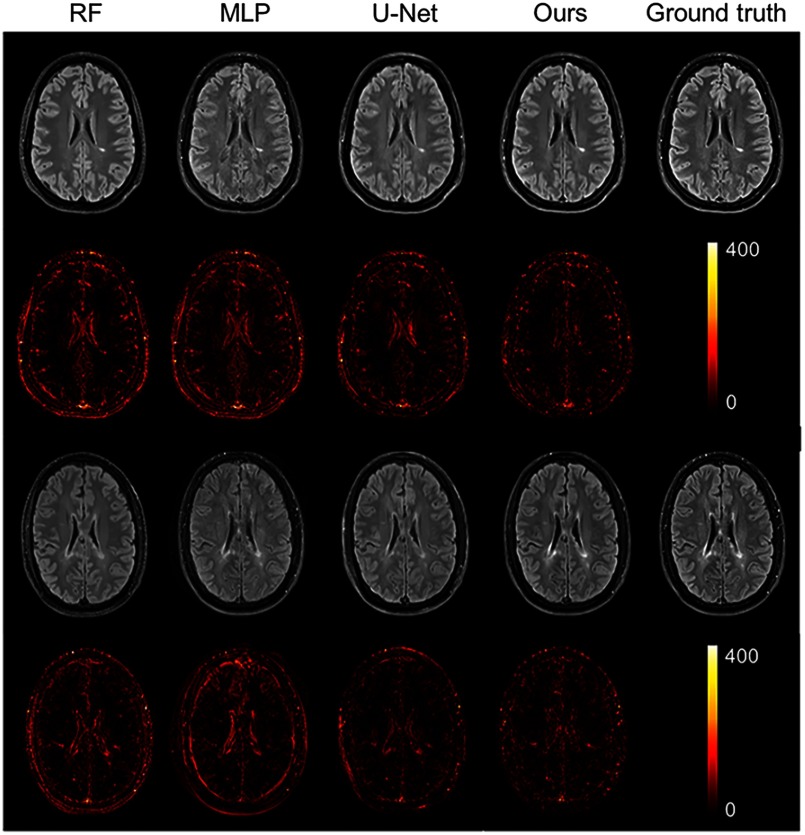
Fig. 4.
Qualitative comparison of the methods to predict the FLAIR sequence. Shown are synthetic FLAIR obtained by RFs with 60 trees, MLP, U-Net, and our method followed by the true FLAIR. The second and fourth rows show the absolute difference maps between each synthetic FLAIR and the ground truth. (Note: for interpretation of the references to color in this figure legend, the reader is referred to the online version of this article.)

