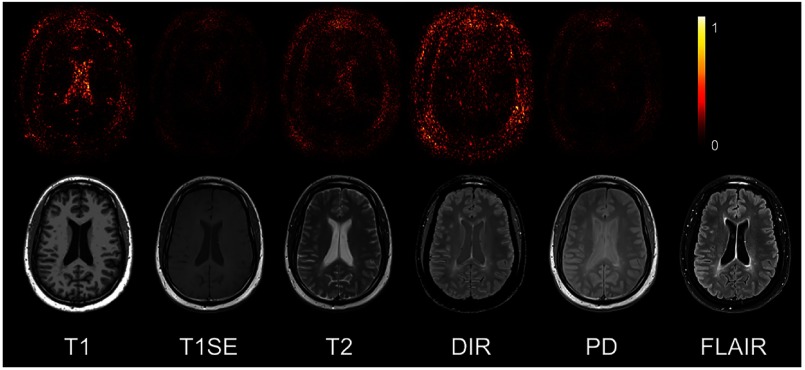
Fig. 6.
The P3S maps for input pulse sequences. The first row is the saliency maps for T1, T1SE, T2, PD, and DIR, respectively. And the second row is the corresponding multisequence MRIs. It can be found that T1-w, DIR, and T2-w contribute more to the FLAIR MRI prediction than PD or T1SE. (Note: for interpretation of the references to color in this figure legend, the reader is referred to the online version of this article.)

