FIGURE 4.
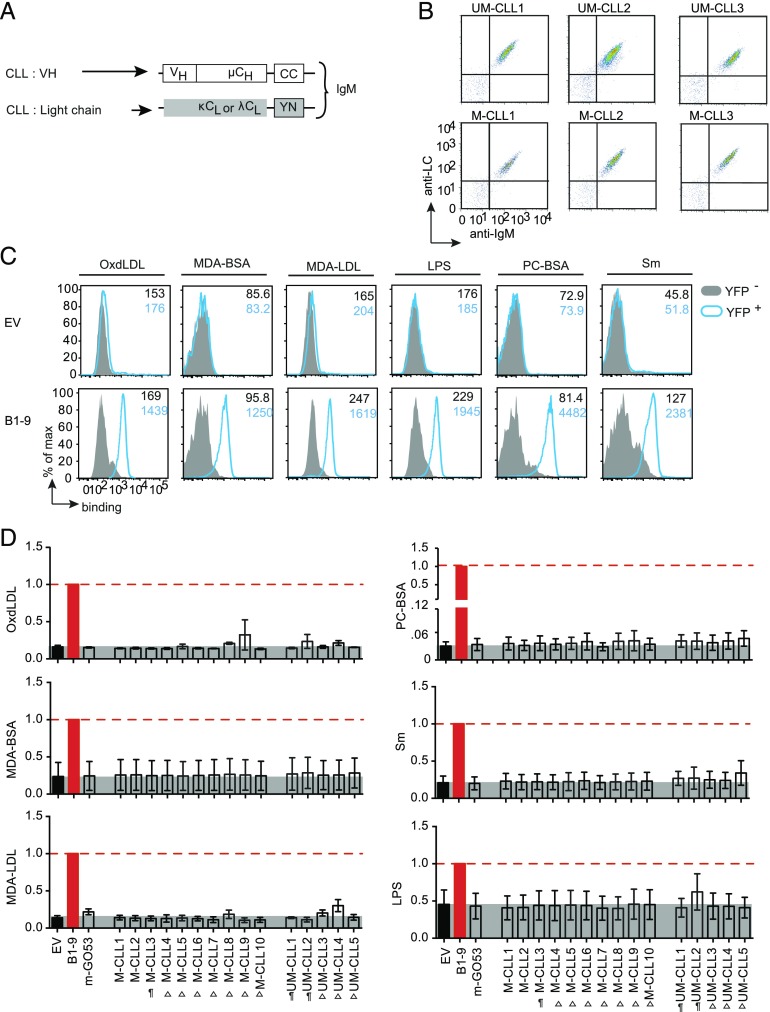
Autoantigen-binding profile of CLL-derived BCRs. (A) Schematic representation of retroviral constructs encoding HC and LC of BCRs derived from different M-CLL (n = 10) and UM-CLL (n = 5) expressed as murine IgM in TKO cells. (B) Representative FACS analysis of BCR expression. The dot plot represents Ig HC and Ig LC expression of six BCRs derived from UM-CLL and M-CLL measured using anti-murine IgM and anti-human LC (κ or λ) polyclonal Abs. The expression data of remaining UM-CLL– and M-CLL–derived BCRs were previously published (20). (C) Representative FACS analysis of different Ag binding of B1-9 IgM-BCR compared with EV control. The Ags are OxdLDL, MDA-BSA, MDA-LDL, LPS, PC-BSA, and Sm as summarized in Fig. 3C. The histogram overlays show Ag binding to transduced YFP+ cells (blue) compared with untransduced YFP− cells (solid gray), and the median fluorescence intensity (MFI) values are indicated in the histogram. The data are representative of a minimum of three independent experiments. (D) Quantification of different Ag binding to CLL-derived BCRs as indicated. The bar graph represents mean ± SEM Ag binding to different IgM-BCRs measured by fold change in MFI of YFP+ and YFP− and compared by using unpaired, nonparametric Mann–Whitney U test. Data are normalized to B1-9 IgM expression (solid red bar), and the normalization value is indicated by a red dashed line. The gray shaded area represents background signal in EV control. The Ags are OxdLDL, MDA-BSA, MDA-LDL, LPS, PC-BSA, and Sm. BCRs derived from CLL cells labeled as “¶” were previously described (20) to exhibit polyreactivity and the unlabeled BCRs were nonpolyreactive as IgG Abs in ELISA. “Δ” denotes the BCRs that were not analyzed for polyreactivity as IgG Abs. The data in (B) and (C) correspond to a minimum of three independent experiments.

