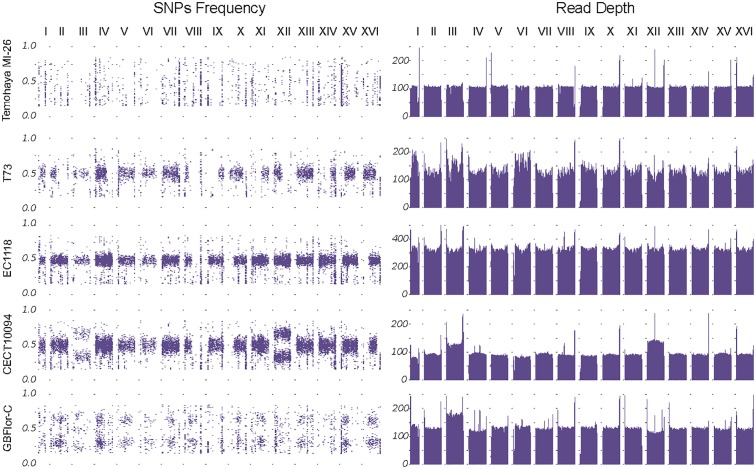
FIGURE 2.
Genome structure of the strains. Left panel: SNP frequencies along the genome. Frequency distribution shows the different ploidies and aneuploidies present. Right panel: Read Depth by chromosomes, smoothed by the mean in 10 kb windows, confirm chromosome III aneuploidy in both GBFlor-C and CECT10094 and the chromosome XII trisomy in CECT10094.

