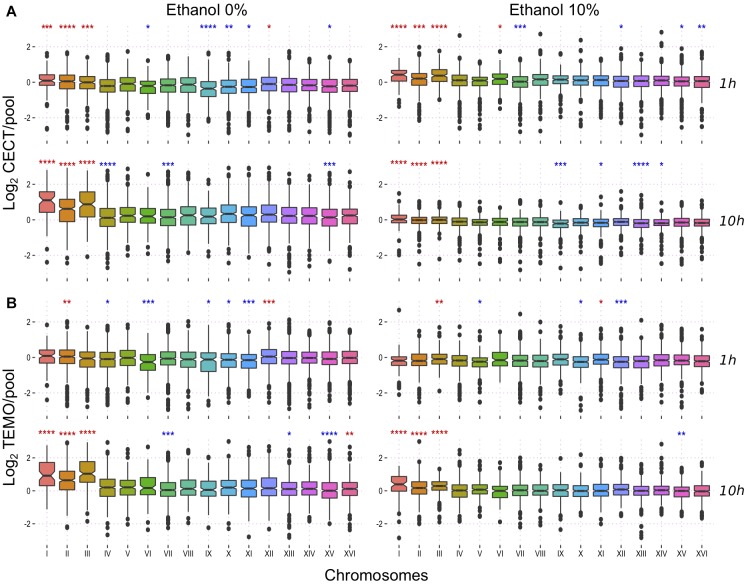
FIGURE 3.
Transcriptional response to ethanol at a chromosomal level. (A) expression fold change of CECT10094 compared to the pool at 1 and 10 h growth with 0 and 10% ethanol stress. (B) expression fold change for Temohaya-MI26. Statistics Wilcoxon test among all groups: ns: p > 0.05, ∗p < 0.05, ∗∗p < 0.01, ∗∗∗p < 0.001, ∗∗∗∗p < 0.0001. Significance symbols are colored in red if the chromosome is upregulated and in blue if it is downregulated.

