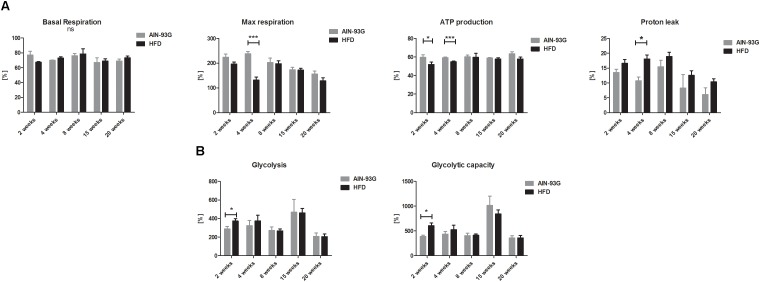
FIGURE 7.
Basal OCR, ATP production, maximal respiration, and mitochondrial proton leak (A) and basal ECAR, glycolysis, glycolytic capacity (B) in primary LSEC isolated from C57Bl/6 mice fed AIN-93G and HFD for 2 and 20 weeks. Values are means ± SD. ∗P < 0.05, ∗∗P < 0.01, ∗∗∗P < 0.001 significantly different from HFD feeding time-matched AIN-93G group values. AIN-93G, AIN-93G diet fed group; HFD, high fat diet fed group.

