Figure 2.

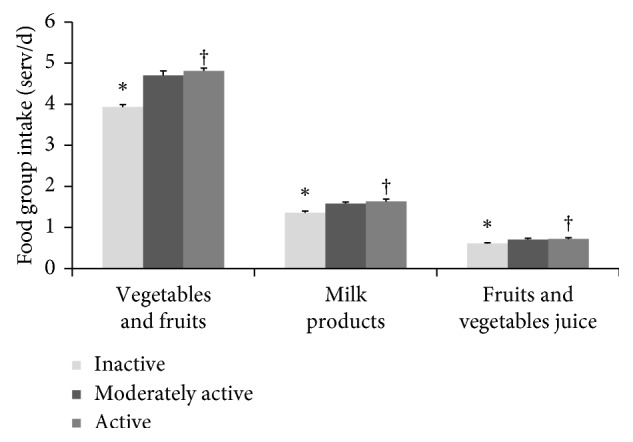
Canadian adults' (18–79 y) mean (±SE) dietary intake (serving/d) differences by level of physical activity. Canadian Health Measures Survey combined Cycles 1 and 2. ∗Significantly different from the reference group. †Reference group.

Canadian adults' (18–79 y) mean (±SE) dietary intake (serving/d) differences by level of physical activity. Canadian Health Measures Survey combined Cycles 1 and 2. ∗Significantly different from the reference group. †Reference group.