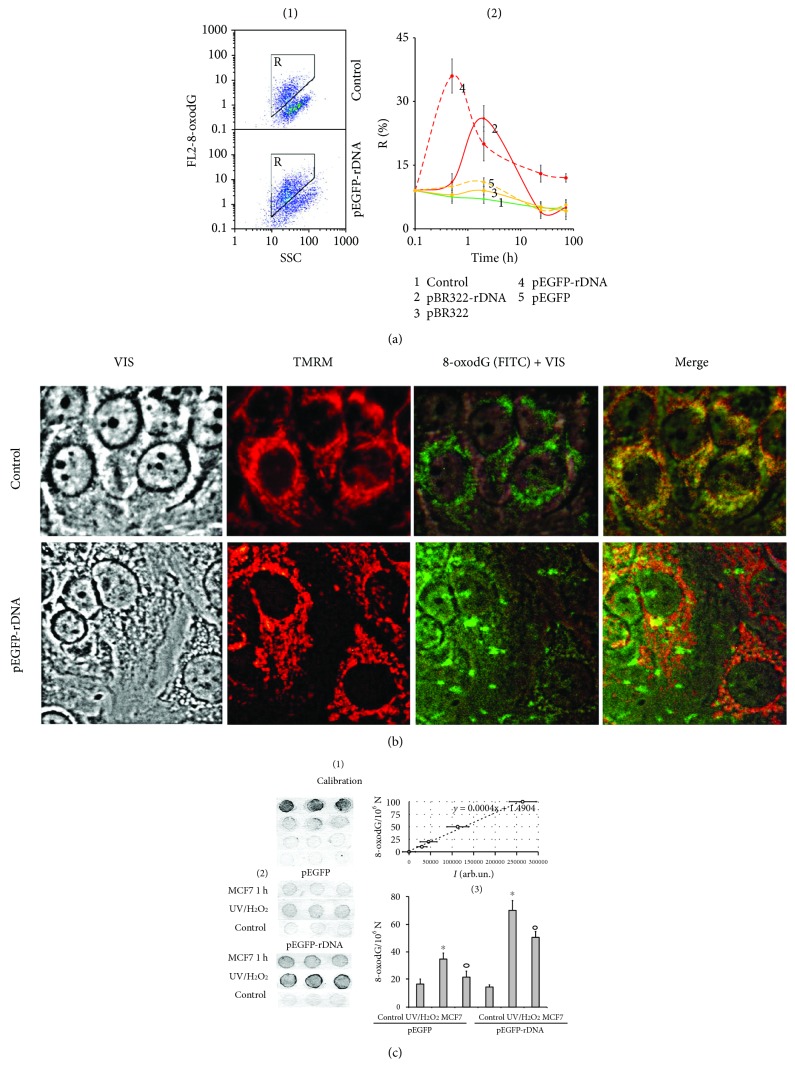
Figure 2.
8-oxodG levels in MCF7. (a) FCA: (1)—cell plots: FL2 (8-oxodG-PE) versus SSC. R: gated area. (2)—relative proportions of 8-oxodG-positive cells in R gate (change with time). (b) FM-based evaluation of mitochondria and 8-oxodG (FITC) in the cells treated with pEGFP-rDNA for 1 h (×40). Unfixed cells were stained with MitoTracker TMRM (15 min, 37° C) and photographed. Next, cells were fixed with 3% paraformaldehyde, treated with 0.1% Triton X100, and 8-oxodG was detected using antibodies (FITC). Photographed in the same field. (c) 8-oxodG levels in pEGFP and pEGFP-rDNA. Immunoassay technique on nitrocellulose membranes using 8-oxodG antibodies conjugated with alkaline phosphatase was used. (1 and 2)—four standard samples of oxidized genomic DNA (10 ng/dot) with a known content of 8-oxodG (was determined by ESI-MS/MS using AB SCIEX 3200 Qtrap machine [18]) were applied in order to plot a calibration curve for the dependence of the signal intensity on the number of 8-oxodG bases. (3 and 4)—the samples of oxidized and nonoxidized (control) pEGFP and pEGFP-rDNA (10 ng/dot) were applied. MCF7 1 h—pEGFP or pEGFP-rDNA after 1 h of incubation with MCF7; UV/H2O2—plasmids were oxidized in 0.1% H2O2 solution with UV irradiation (λ > 312 nm) for 3 minutes at 25°C (Vilber Lourmat equipment, TCP-20.LM).

