Figure 3.

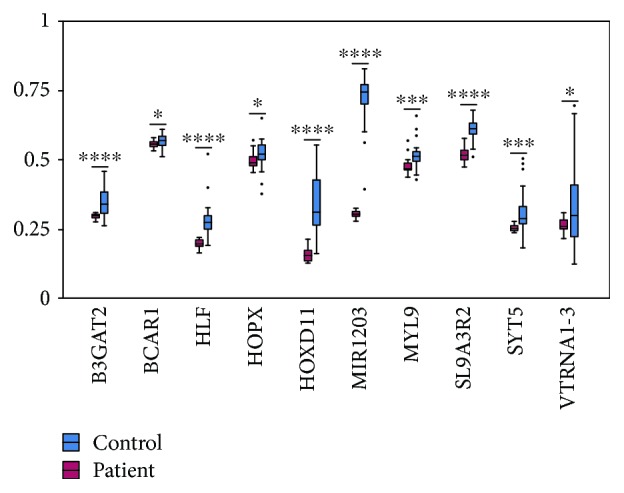
The comparison of methylation level between patients and controls of ten selected genes. ∗ to ∗∗∗∗ represents p values of < 0.05, 0.01, 0.001, and 0.0001.

The comparison of methylation level between patients and controls of ten selected genes. ∗ to ∗∗∗∗ represents p values of < 0.05, 0.01, 0.001, and 0.0001.